CategorizingSoftware
Applications for Maintenance - ESE Online Appendix
<< BACK
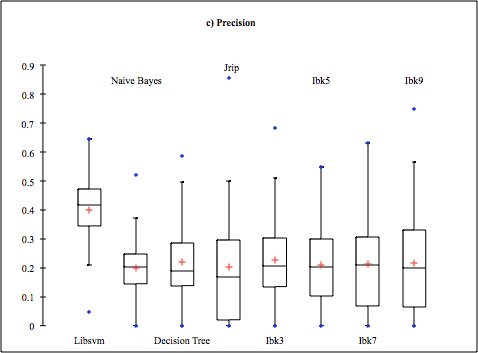
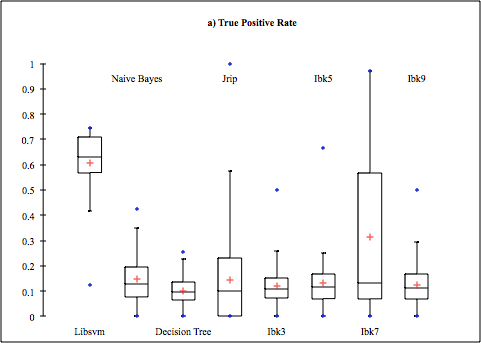
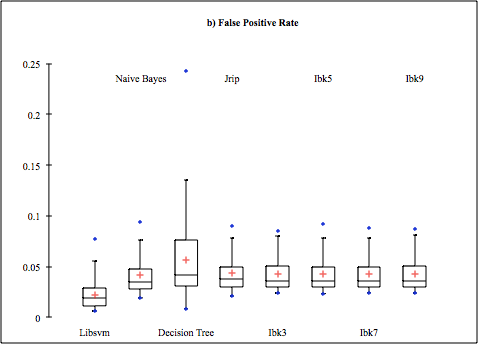
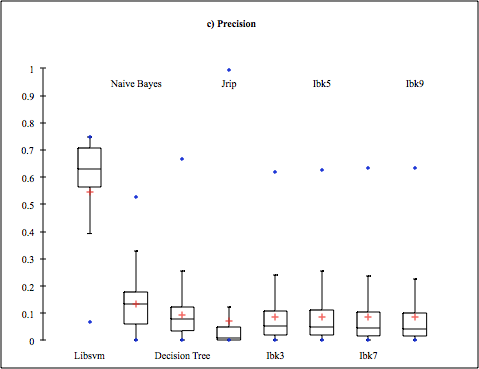
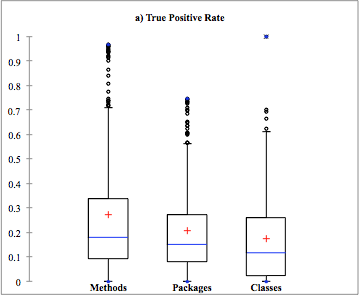
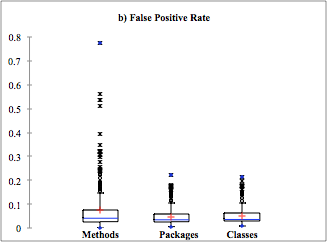
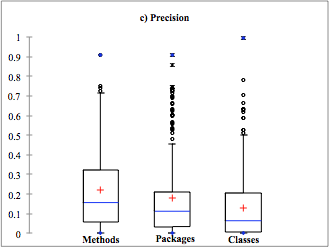
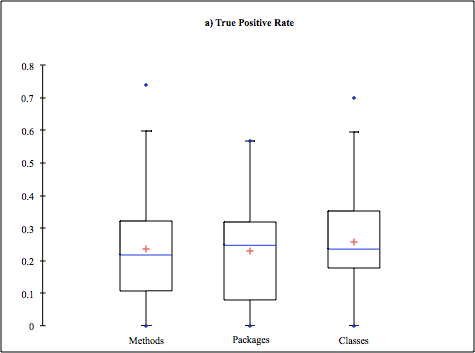
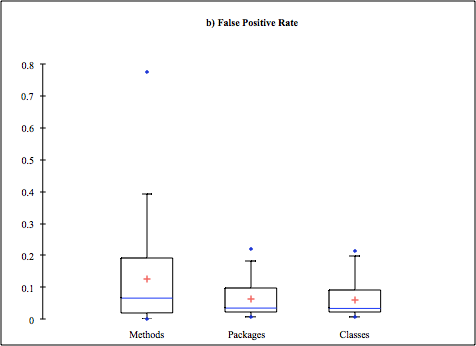
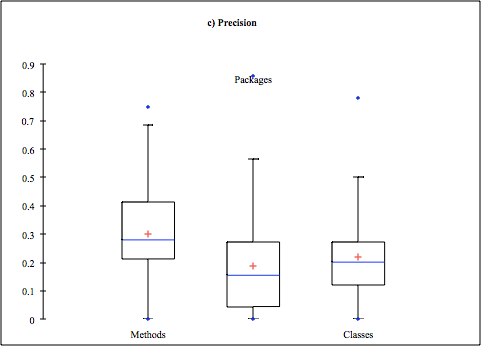
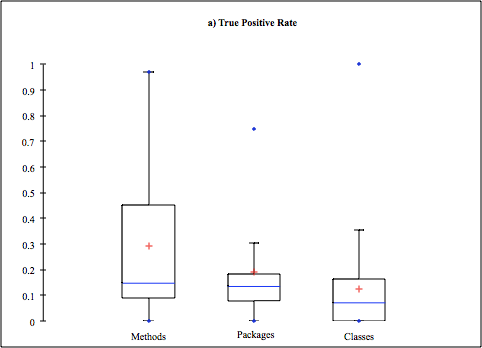
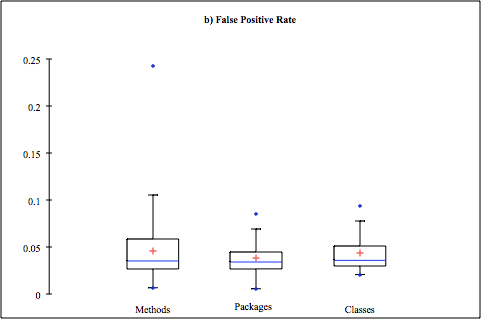
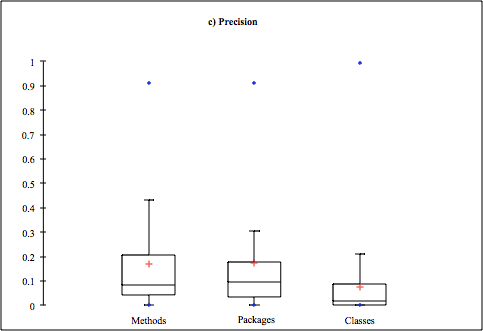
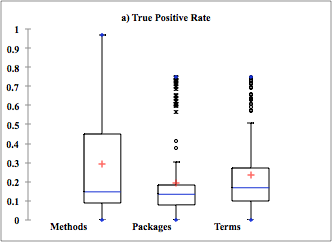
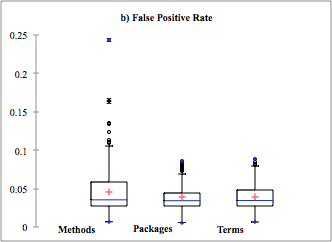
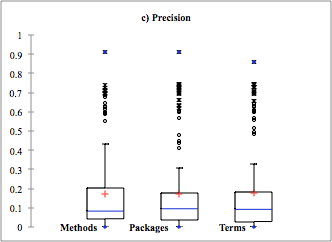
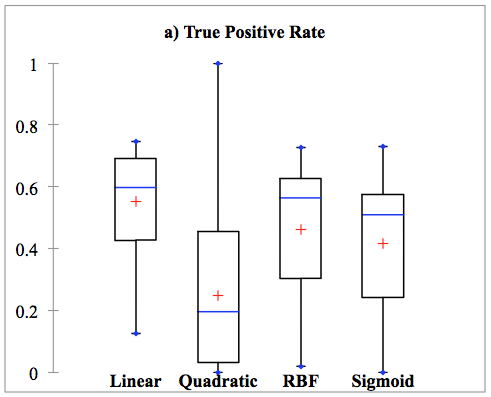
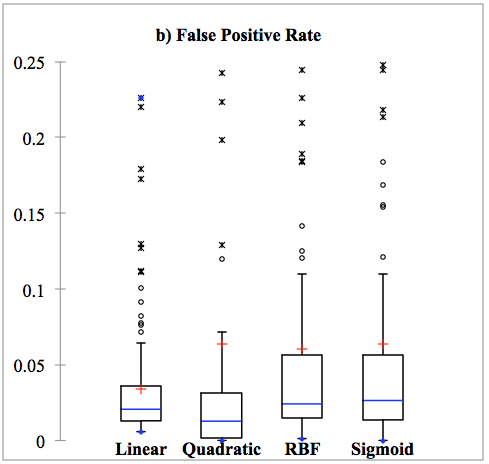
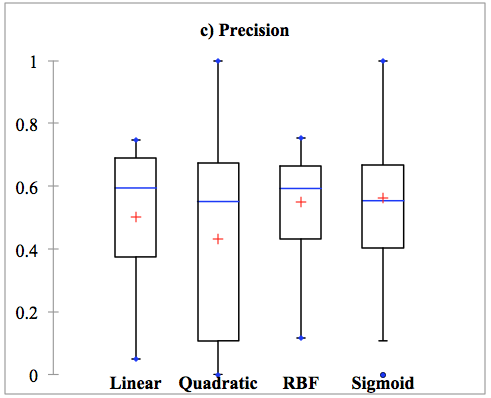
Metrics Results and Statistical Validation and Tests
Each spreadsheet has the data used in the tests, the test
results, descriptive statistics and comments
about the data.
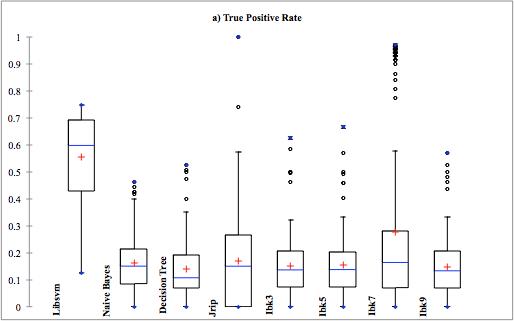
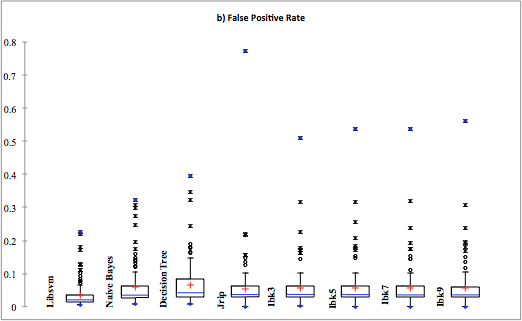
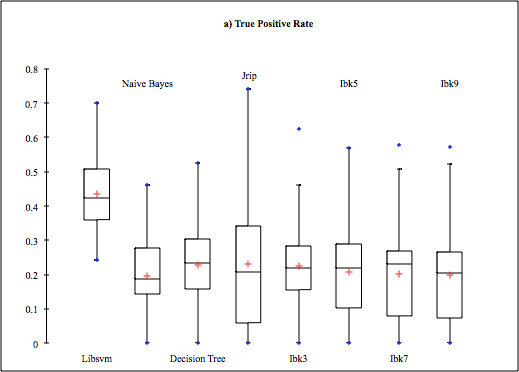
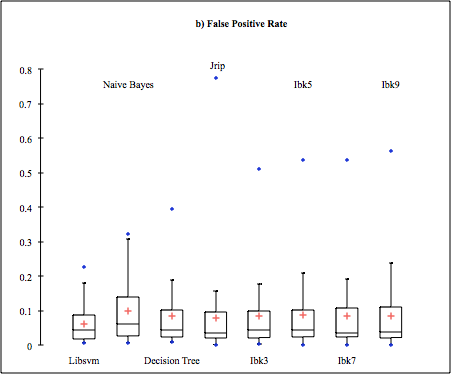
TPR :="True
Positive Rate"; FPR :="False Positive Rate"; PRC := "Precision"
<<BACK
Authors
- Collin McMillan - The College of William and Mary
E-mail: cmc at cs dot wm
dot edu
- Mario
Linares-Vásquez - Universidad Nacional de Colombia
E-mail: mlinaresv at unal dot
edu dot co
- Denys Poshyvanyk
- The College of William and
Mary
E-mail: denys at cs dot
wm dot edu
- Mark Grechanik
- Accenture Technology Labs
and The University of Illinois at Chicago
E-mail: drmark at uic dot
edu