How Developers Micro-Optimize Android Apps - JSS Online Appendix
This web page is a companion to our JSS submission entitled "How Developers Micro-Optimize Android Apps".
Abstract
Optimizing mobile apps early on in the development cycle is supposed to be a key strategy for obtaining higher user rankings, more downloads (and revenue), and higher retention. In fact, mobile platform designers publish specific guidelines, practices, and tools aimed at optimizing apps. However, little research has been done into identifying and understanding actual optimization practices performed by developers. In this paper, we present the results of three empirical studies aimed at investigating practices of Android developers towards improving performance of their apps, in particular by means of micro-optimizations. We mined change histories of 3,513 Android apps to identify most frequent micro-optimization warnings in 297K+ snapshots of these apps and to understand if (and when) developers implement these optimizations. Then, we performed an in-depth analysis into whether implementing micro-optimizations can help reduce memory and CPU usage in a subset of Android apps. Finally, we conducted a survey with 389 open-source developers to understand how they use micro-optimizations to improve the performance of Android apps. Surprisingly, our results indicate that although open source Android apps have a great number of micro-optimization opportunities throughout their change histories, developers rarely implement them. Also, the impact of the subset of analyzed micro-optimization on CPU and memory consumption of Android apps is in most of the cases negligible. Finally, the results from the survey shed some light into why this happens as well as upon which practices Android developers rely upon in their practice.RQ1: Top Micro-Optimization opportunities in Apps at GitHub
- Complete Micro-Optimization opportunities Frequencies in Descending Order Normalized by Number of Files
- Complete Micro-Optimization opportunities Frequencies in Descending Order Raw Frequencies
- Complete Micro-Optimization opportunities Frequencies in Descending Order Normalized by LOC
RQ2: Persistence of Micro-Optimization opportunities in Change Histories of Android Apps
- Average R-Square For Micro-Optimization opportunities Categories (2 sheets - one for global and one for categories)
- Top 5 Representative Functions for the Micro-Optimization opportunities Categories and Global
- Complete Data for the Frequencies of Each Function for the Micro-Optimization opportunities Categories
RQ3: Measuring the Impact of Micro-Optimizations on Performance and Resource Usage
Analyzed Apps
| App | Coverage | Micro-Opt. Opportunities | |||||||
|---|---|---|---|---|---|---|---|---|---|
| Name | KLOC | Branch | Stmt | Methd | Total | Opt | String | Lint | Tot |
| AnCal | 14 | 73.6% | 82.6% | 85% | 83.2% | 334 | 22 | 22 | 378 |
| AndroidBicycle | 5 | 35.3% | 57.9% | 59.1% | 54.5% | 136 | 2 | 6 | 144 |
| Hangeulider | 1 | 69% | 89.8% | 90% | 86.3% | 148 | 1 | 147 | 296 |
| HealthFoodConcepts | 20 | 74.4% | 77.1% | 78.8% | 76.7% | 26 | 343 | 9 | 378 |
| evaSppA | 5 | 54.4% | 70.3% | 63.3% | 67.8% | 10 | 64 | 27 | 101 |
| RaspberryBusMalaysia | 4 | 63% | 86.7% | 89.2% | 82.1% | 6 | 59 | 6 | 71 |
| Subsonic-Android | 14 | 58.9% | 71.8% | 74.8% | 69.6% | 6 | 20 | 100 | 126 |
| HeartsSky | 4 | 51.1% | 63.4% | 55.7% | 60.7% | 60 | 1 | 169 | 230 |
Detailed App Information
This link provides the following data for each App:- Coverage Reports
- XML Format
- HTML Browsable Format
- PDF Format
- Micro-Optimizations List
- GetEvent Execution Trace
CPU and Memory Consumption Measurements
This link provides the following data regarding the measurement for each APK version (optimized versions and original):- APK file
- GetEvent Execution Trace
- CPU Consumption
- Memory Consumption
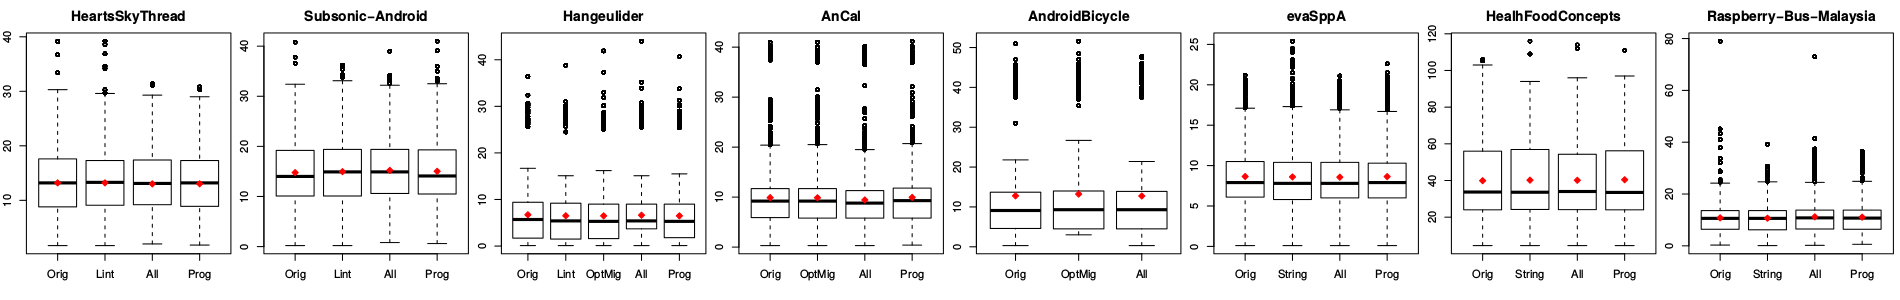
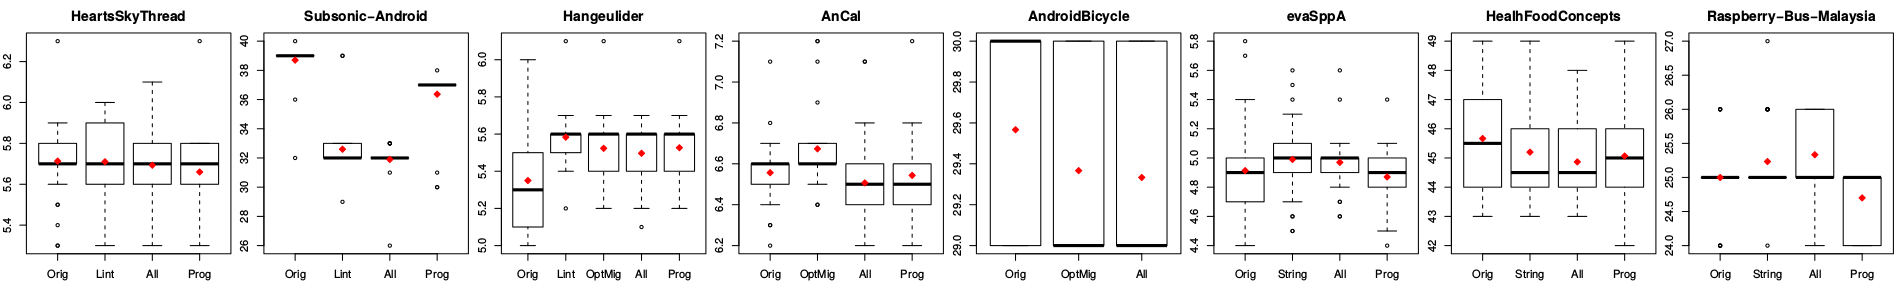
Data Analysis: Boxplots
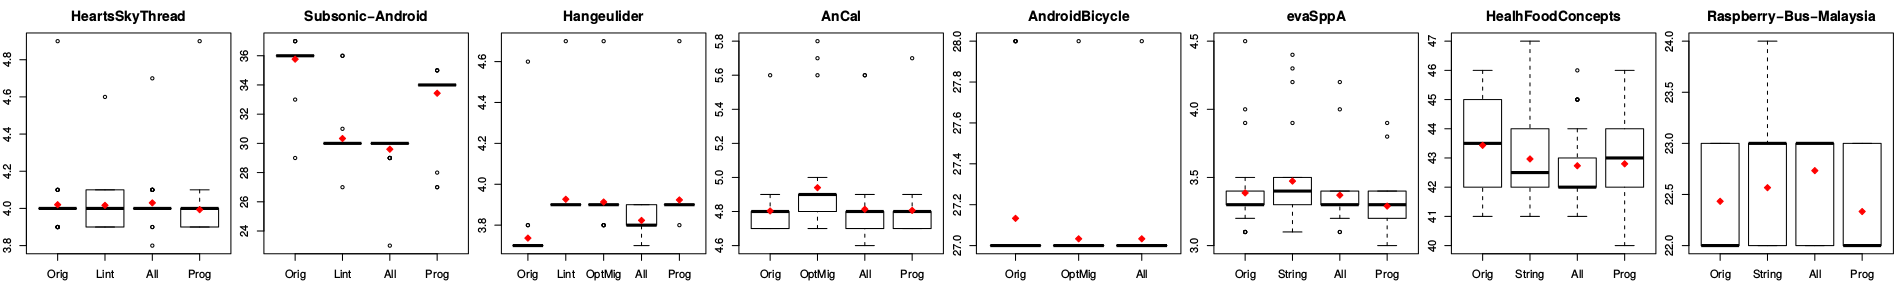
CPU - Distribution of Values
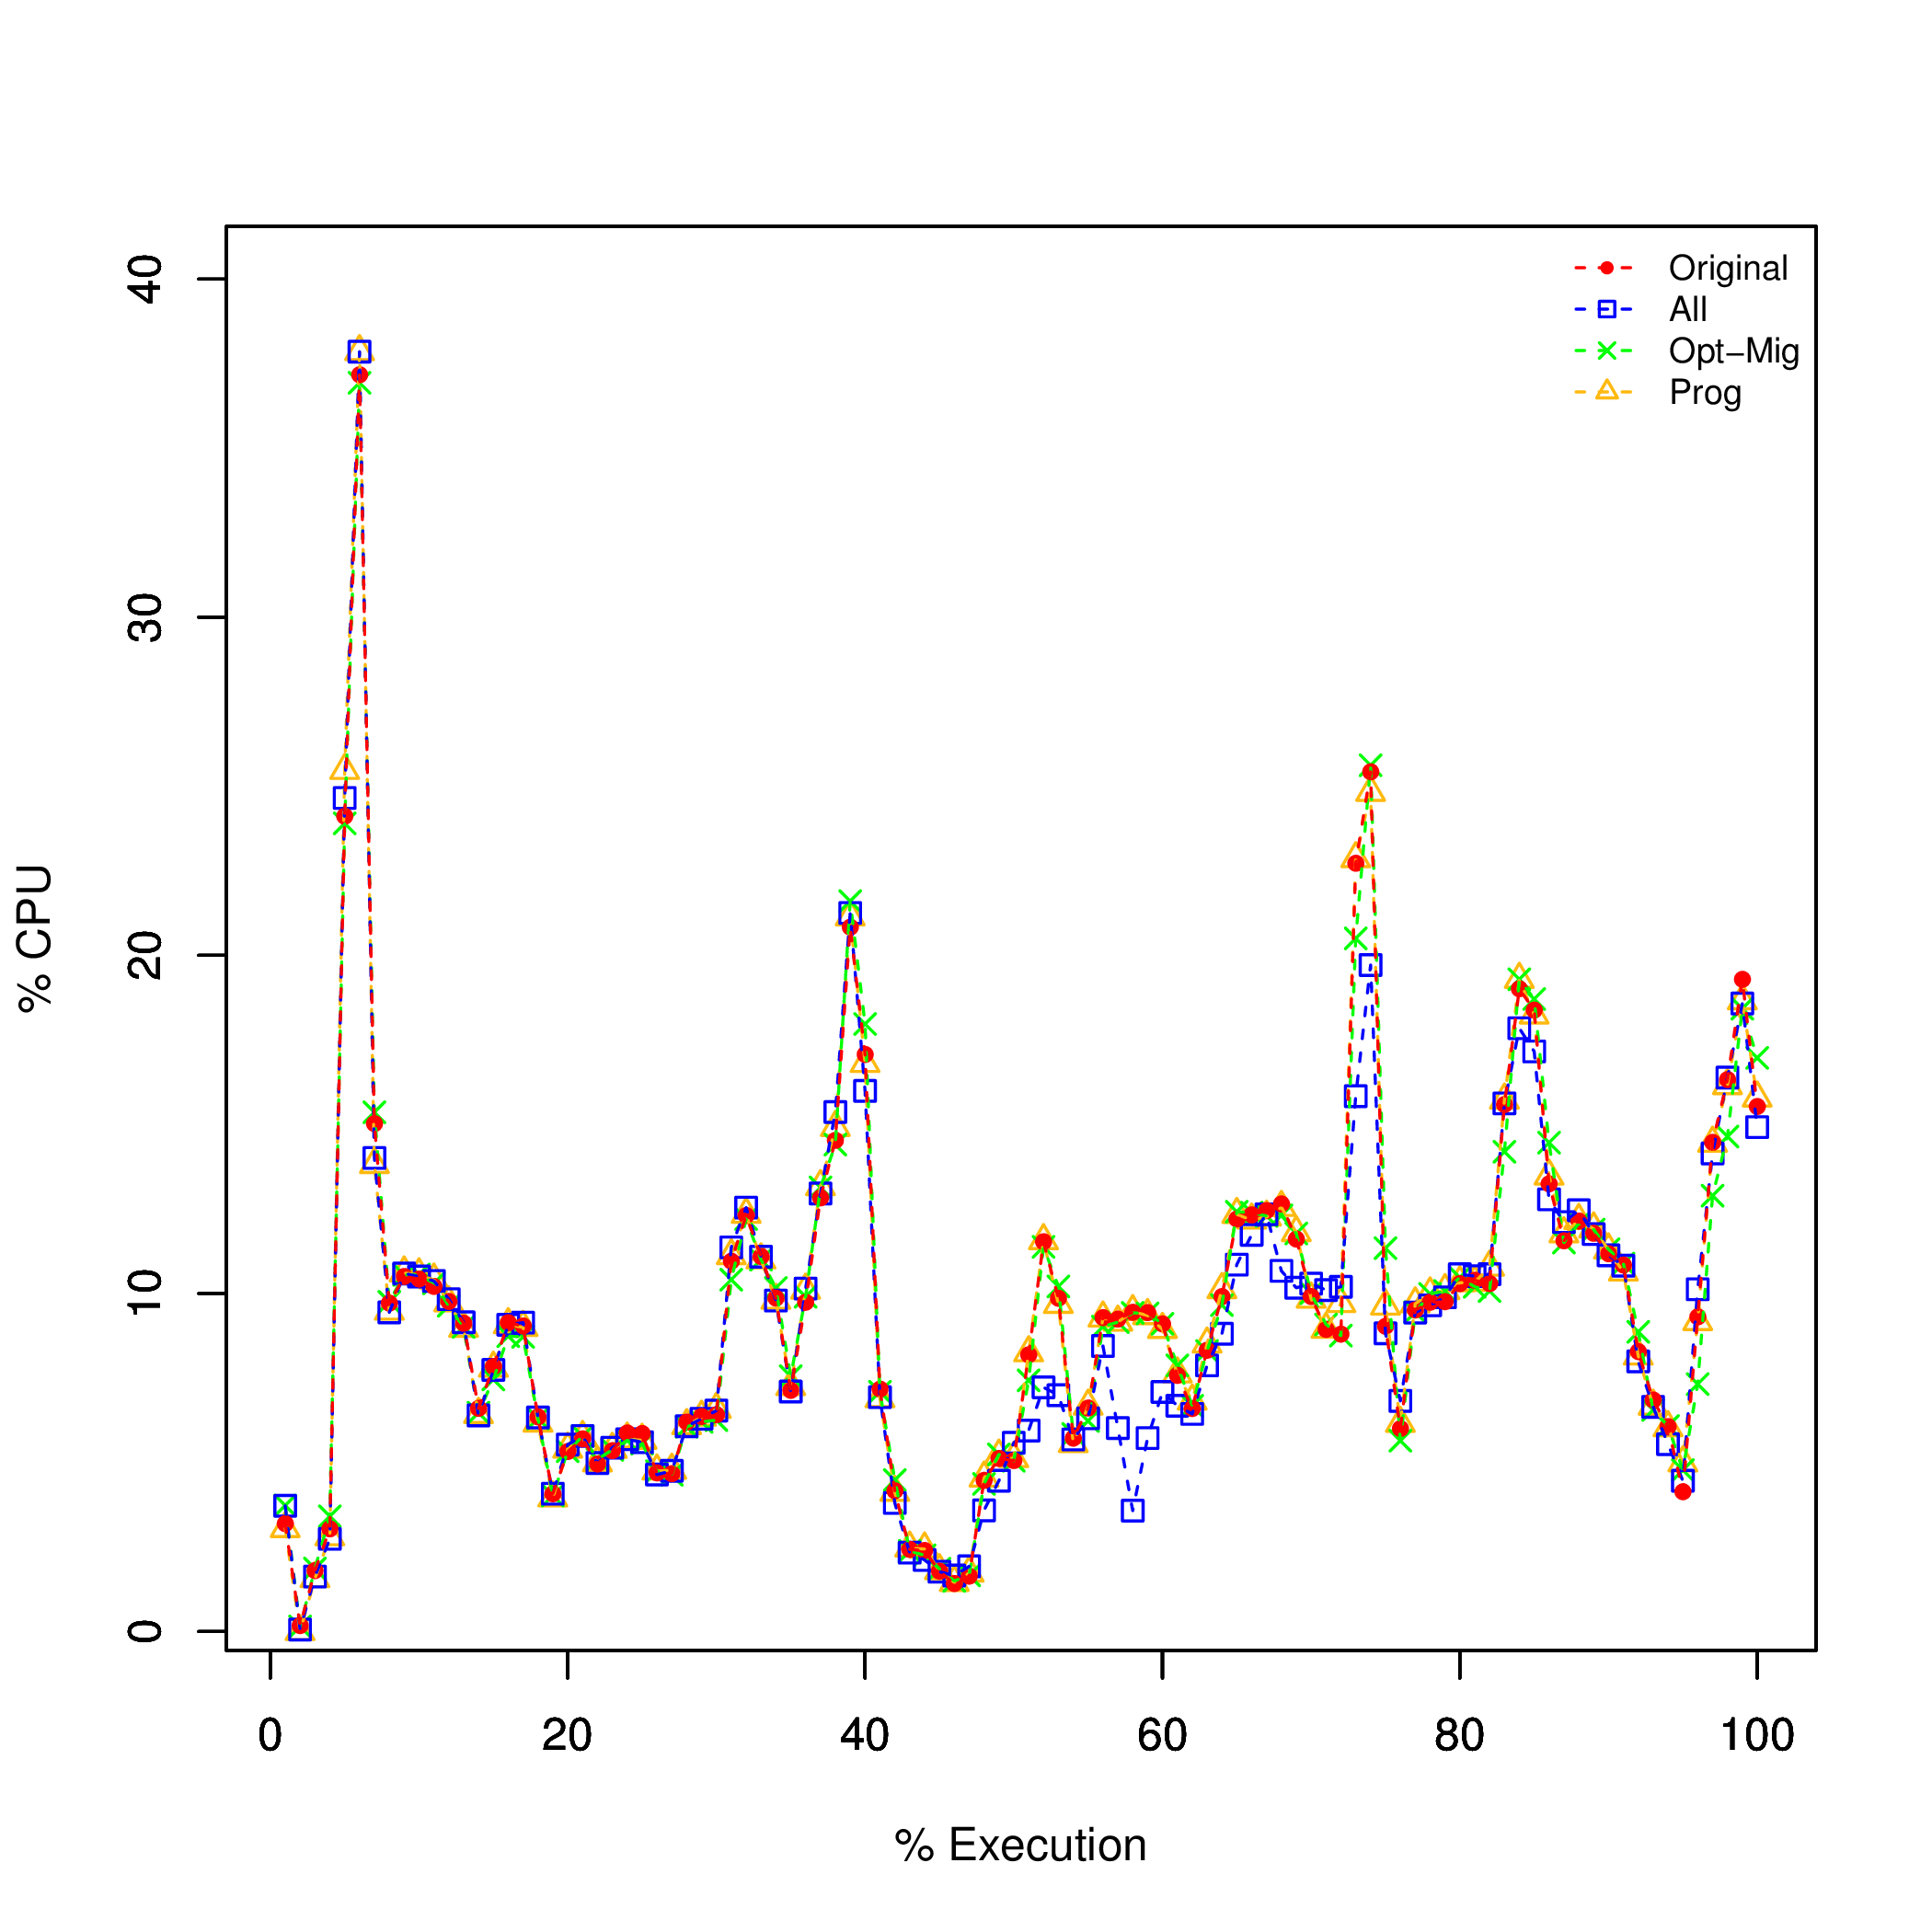
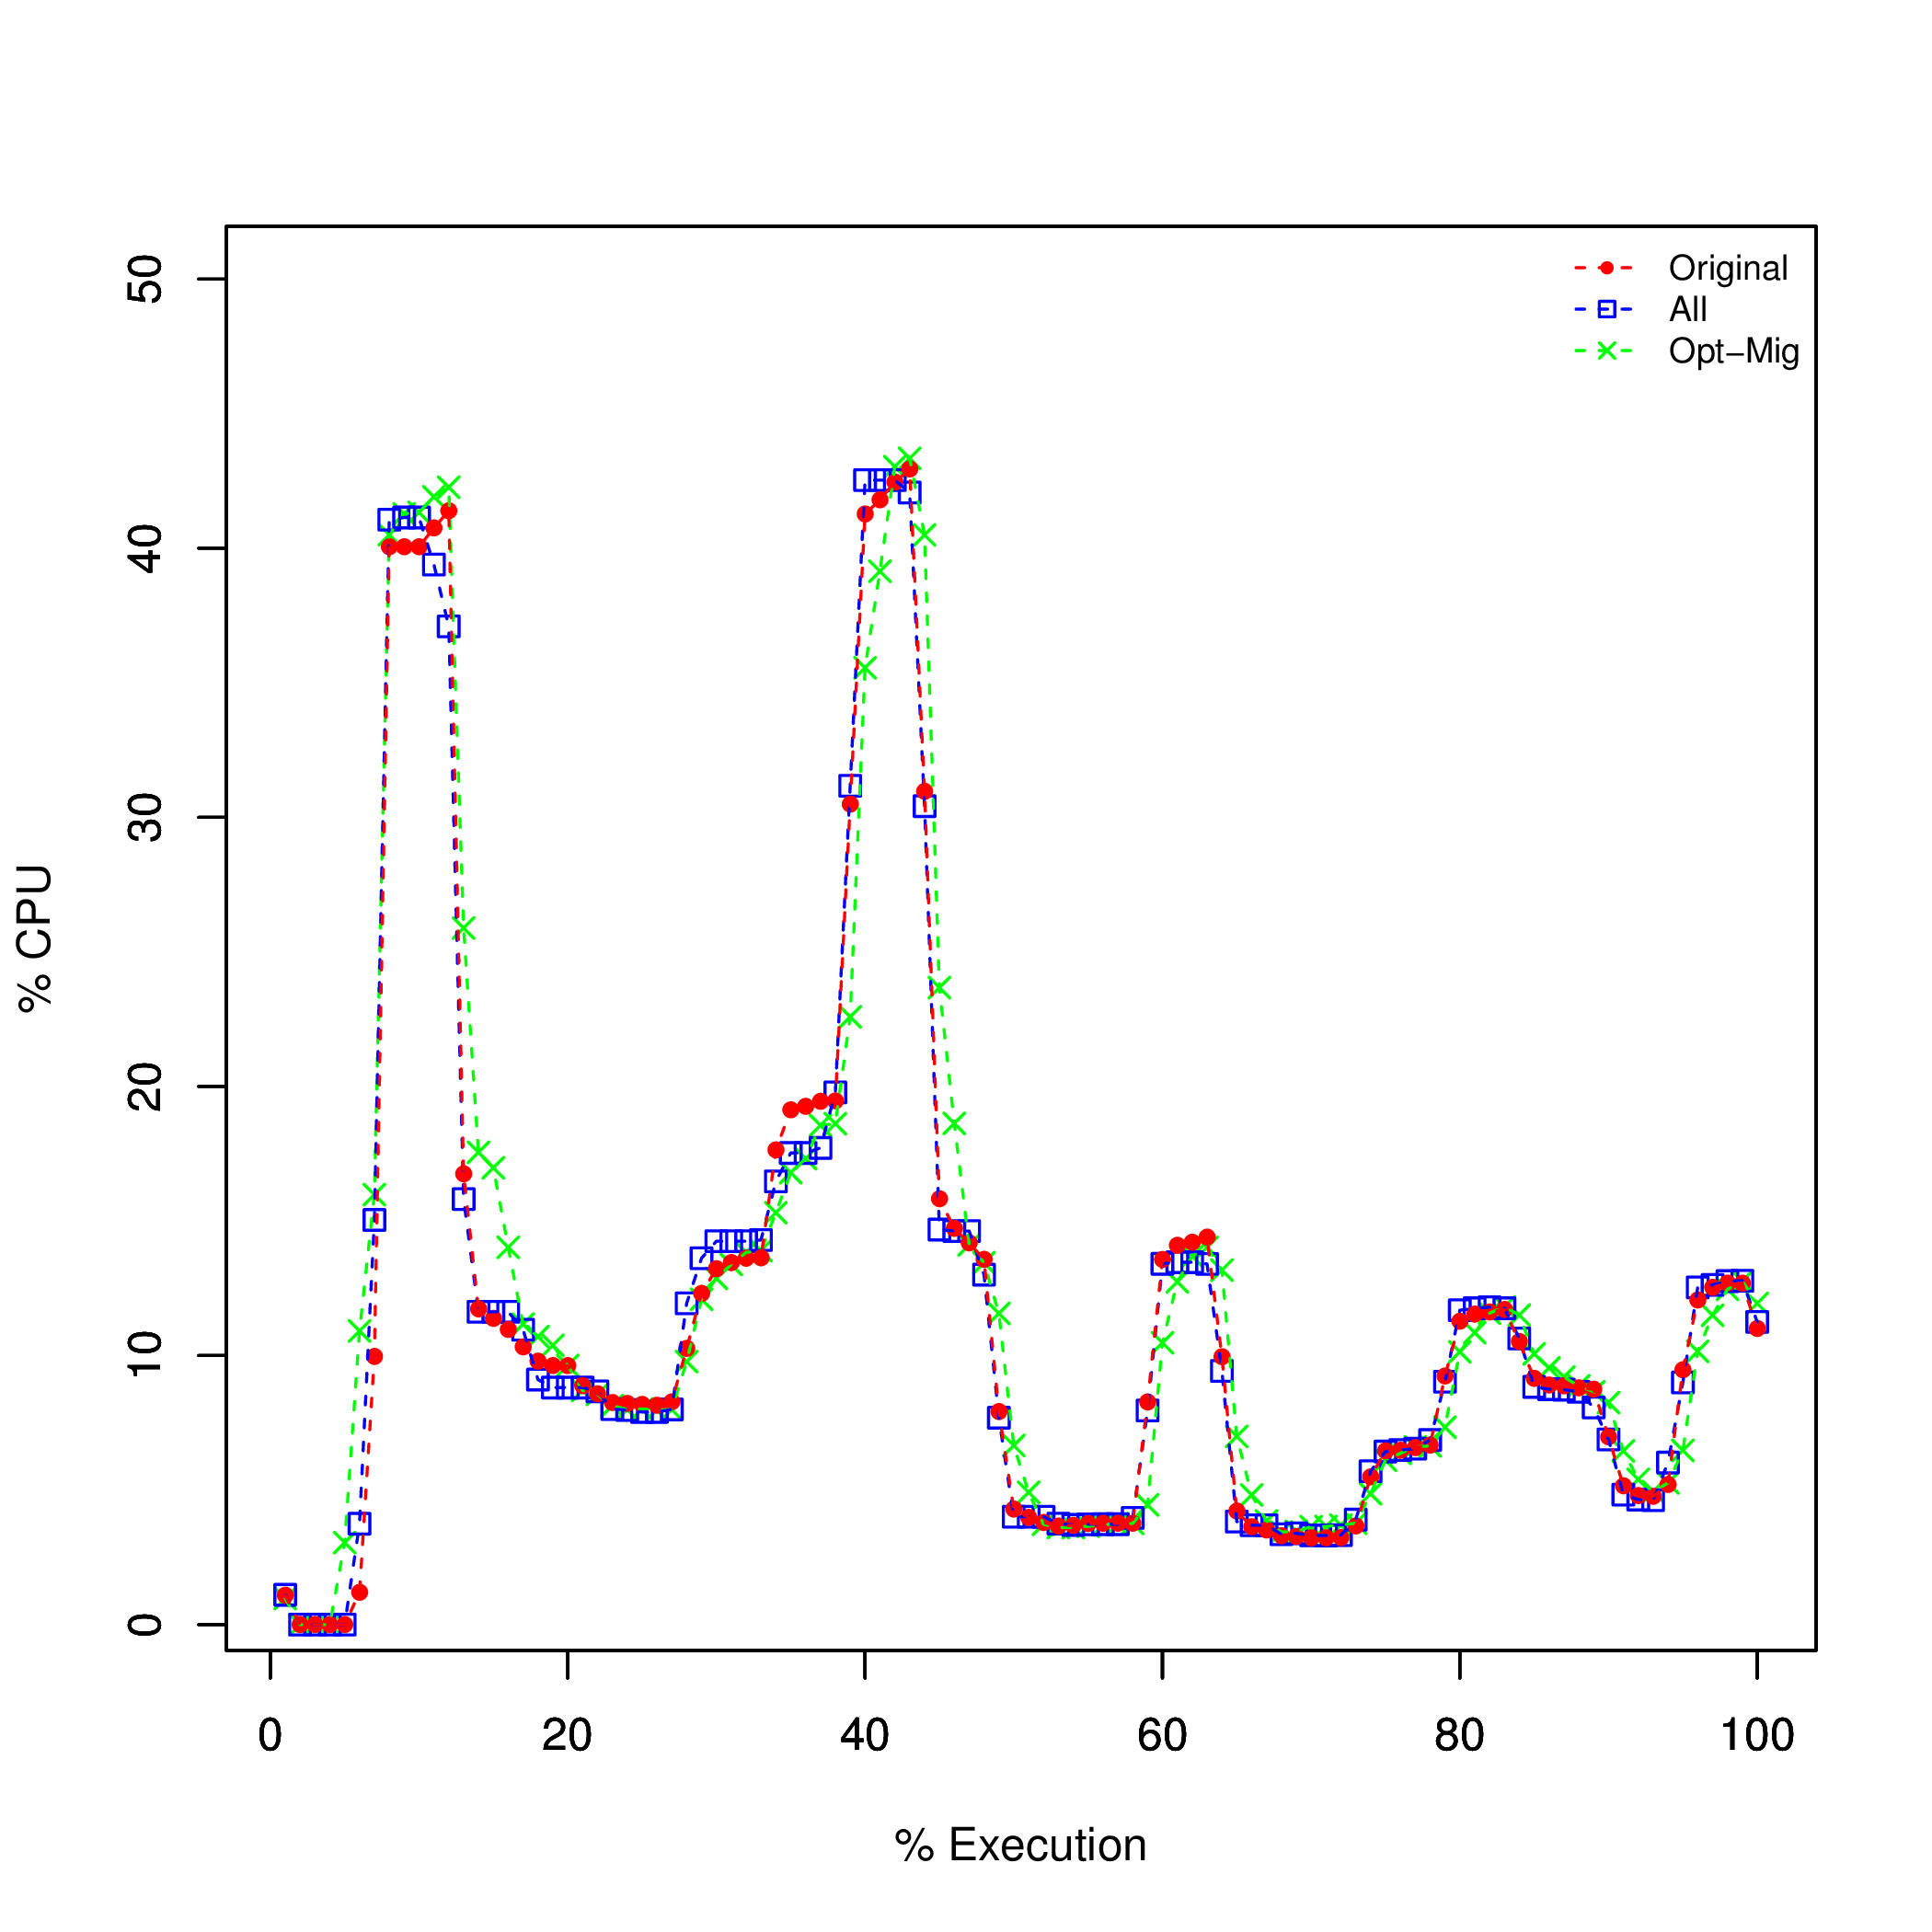
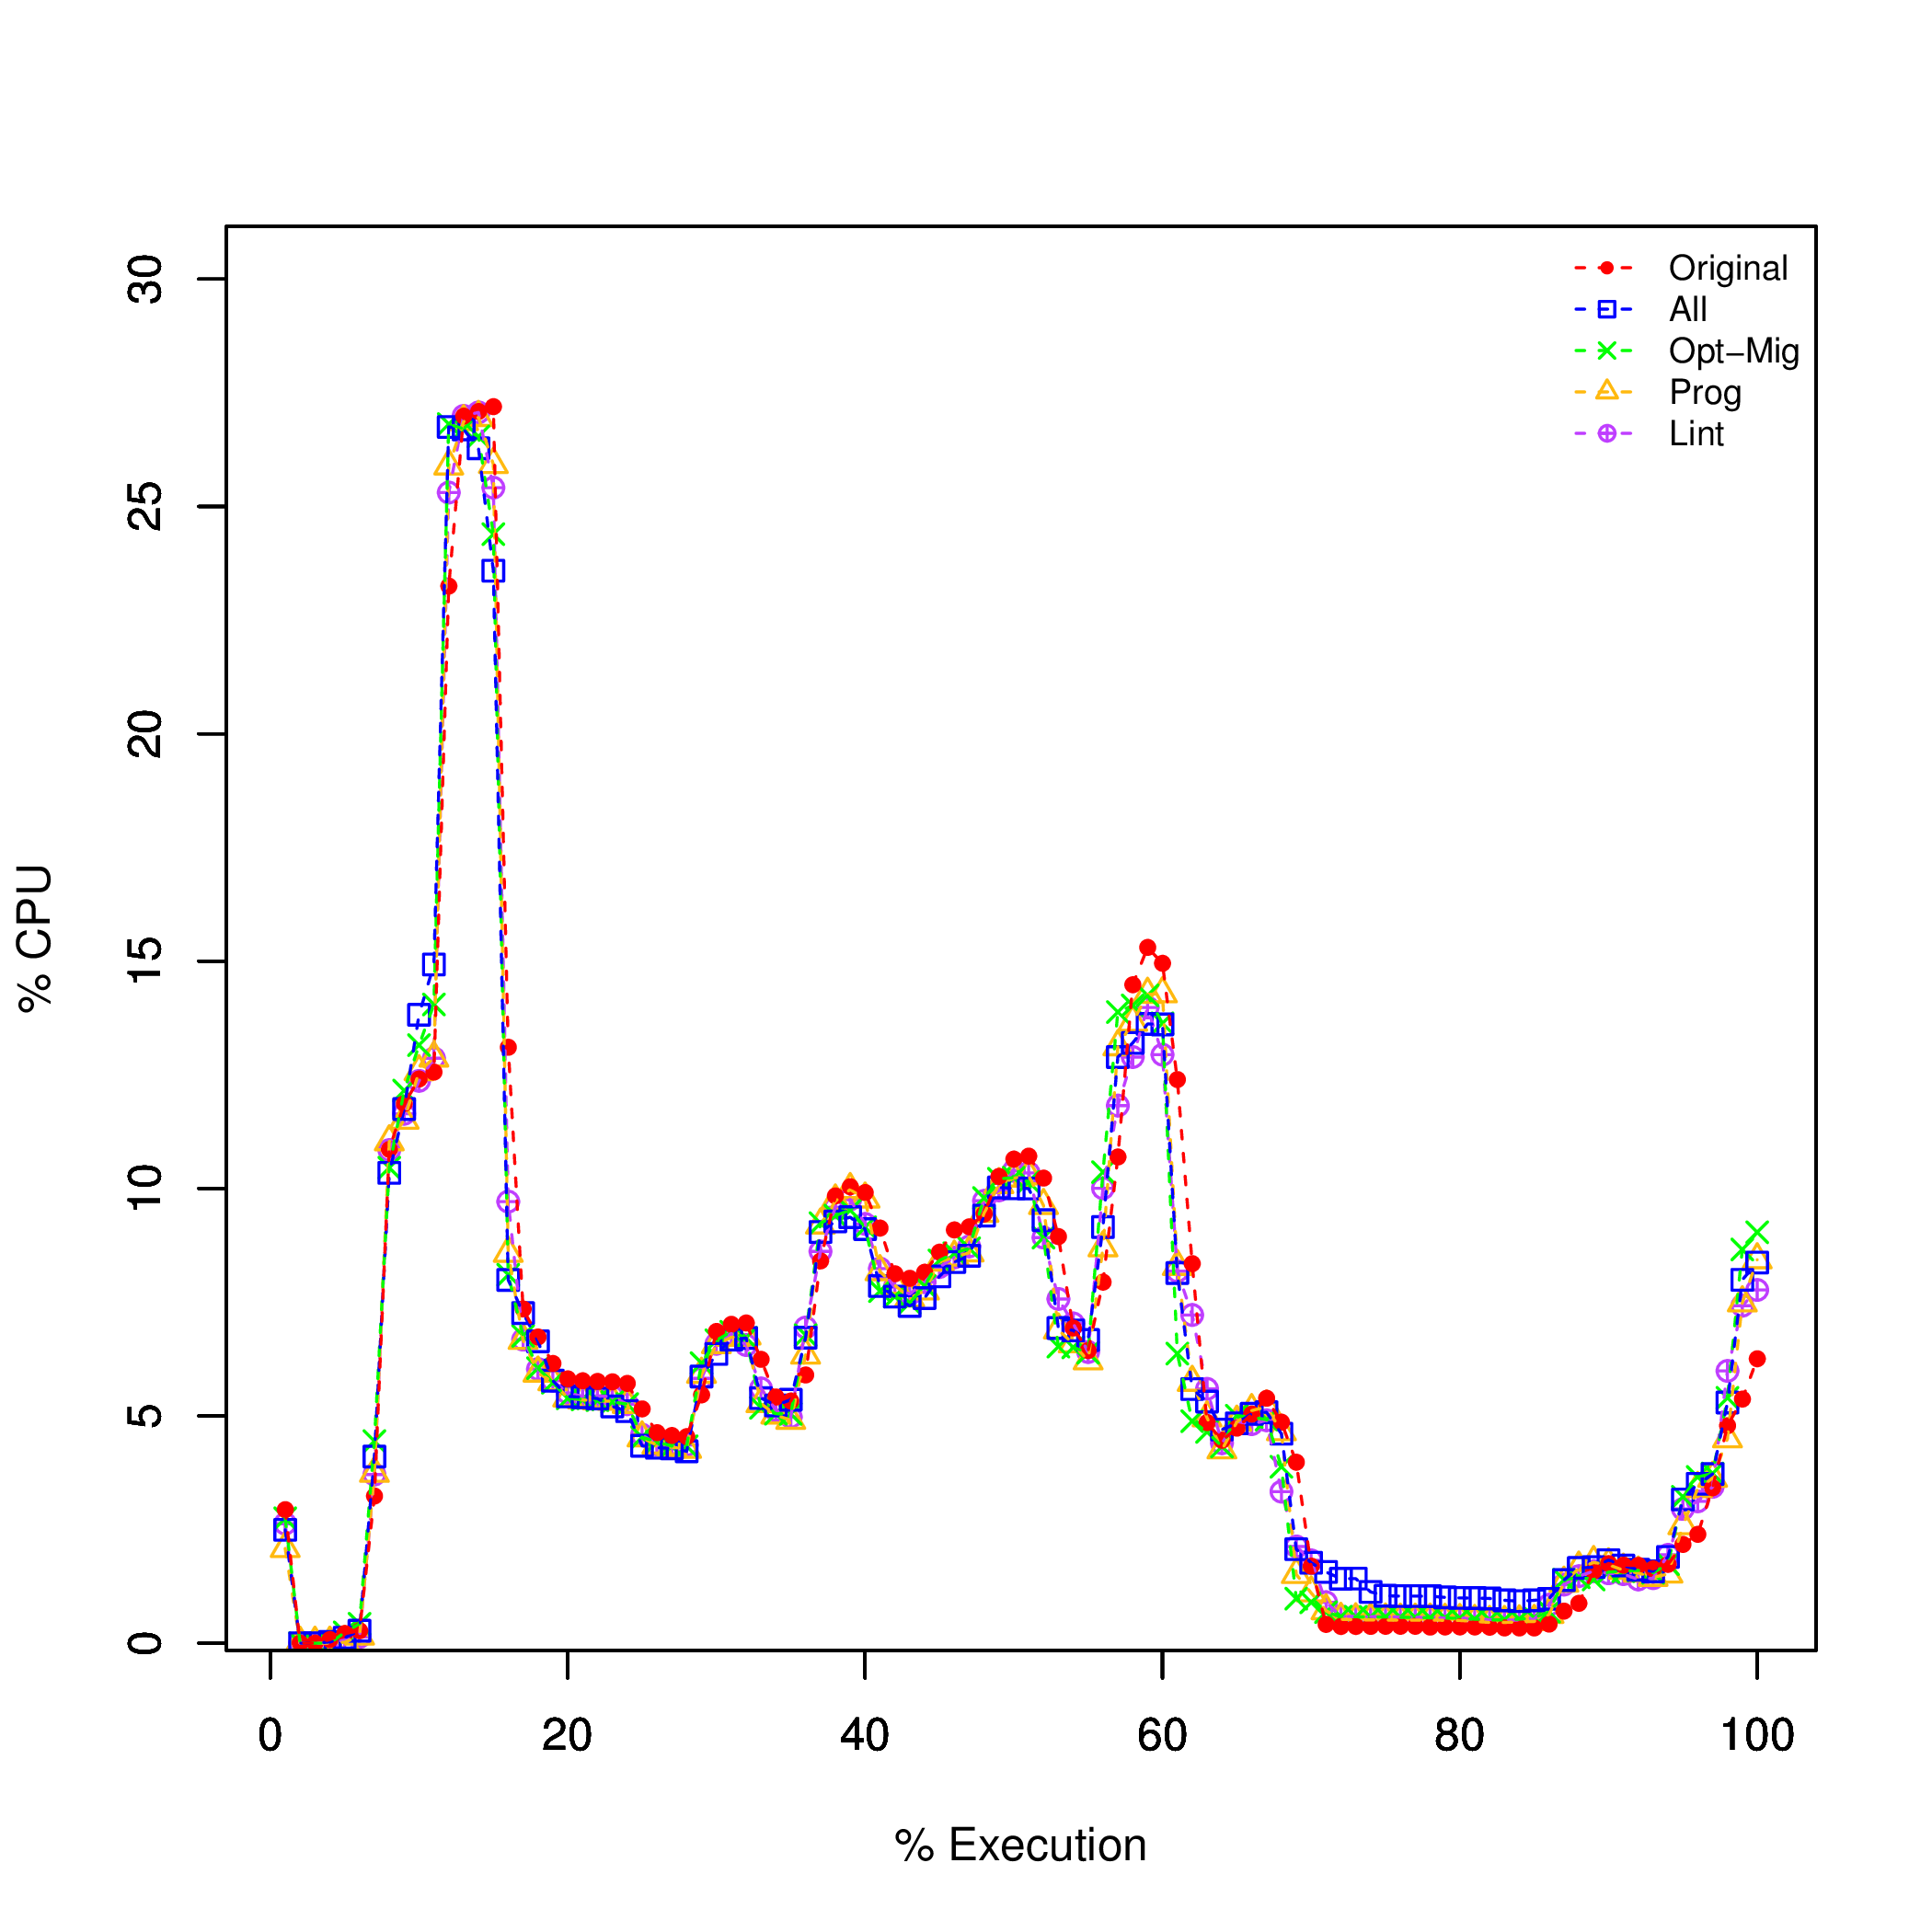
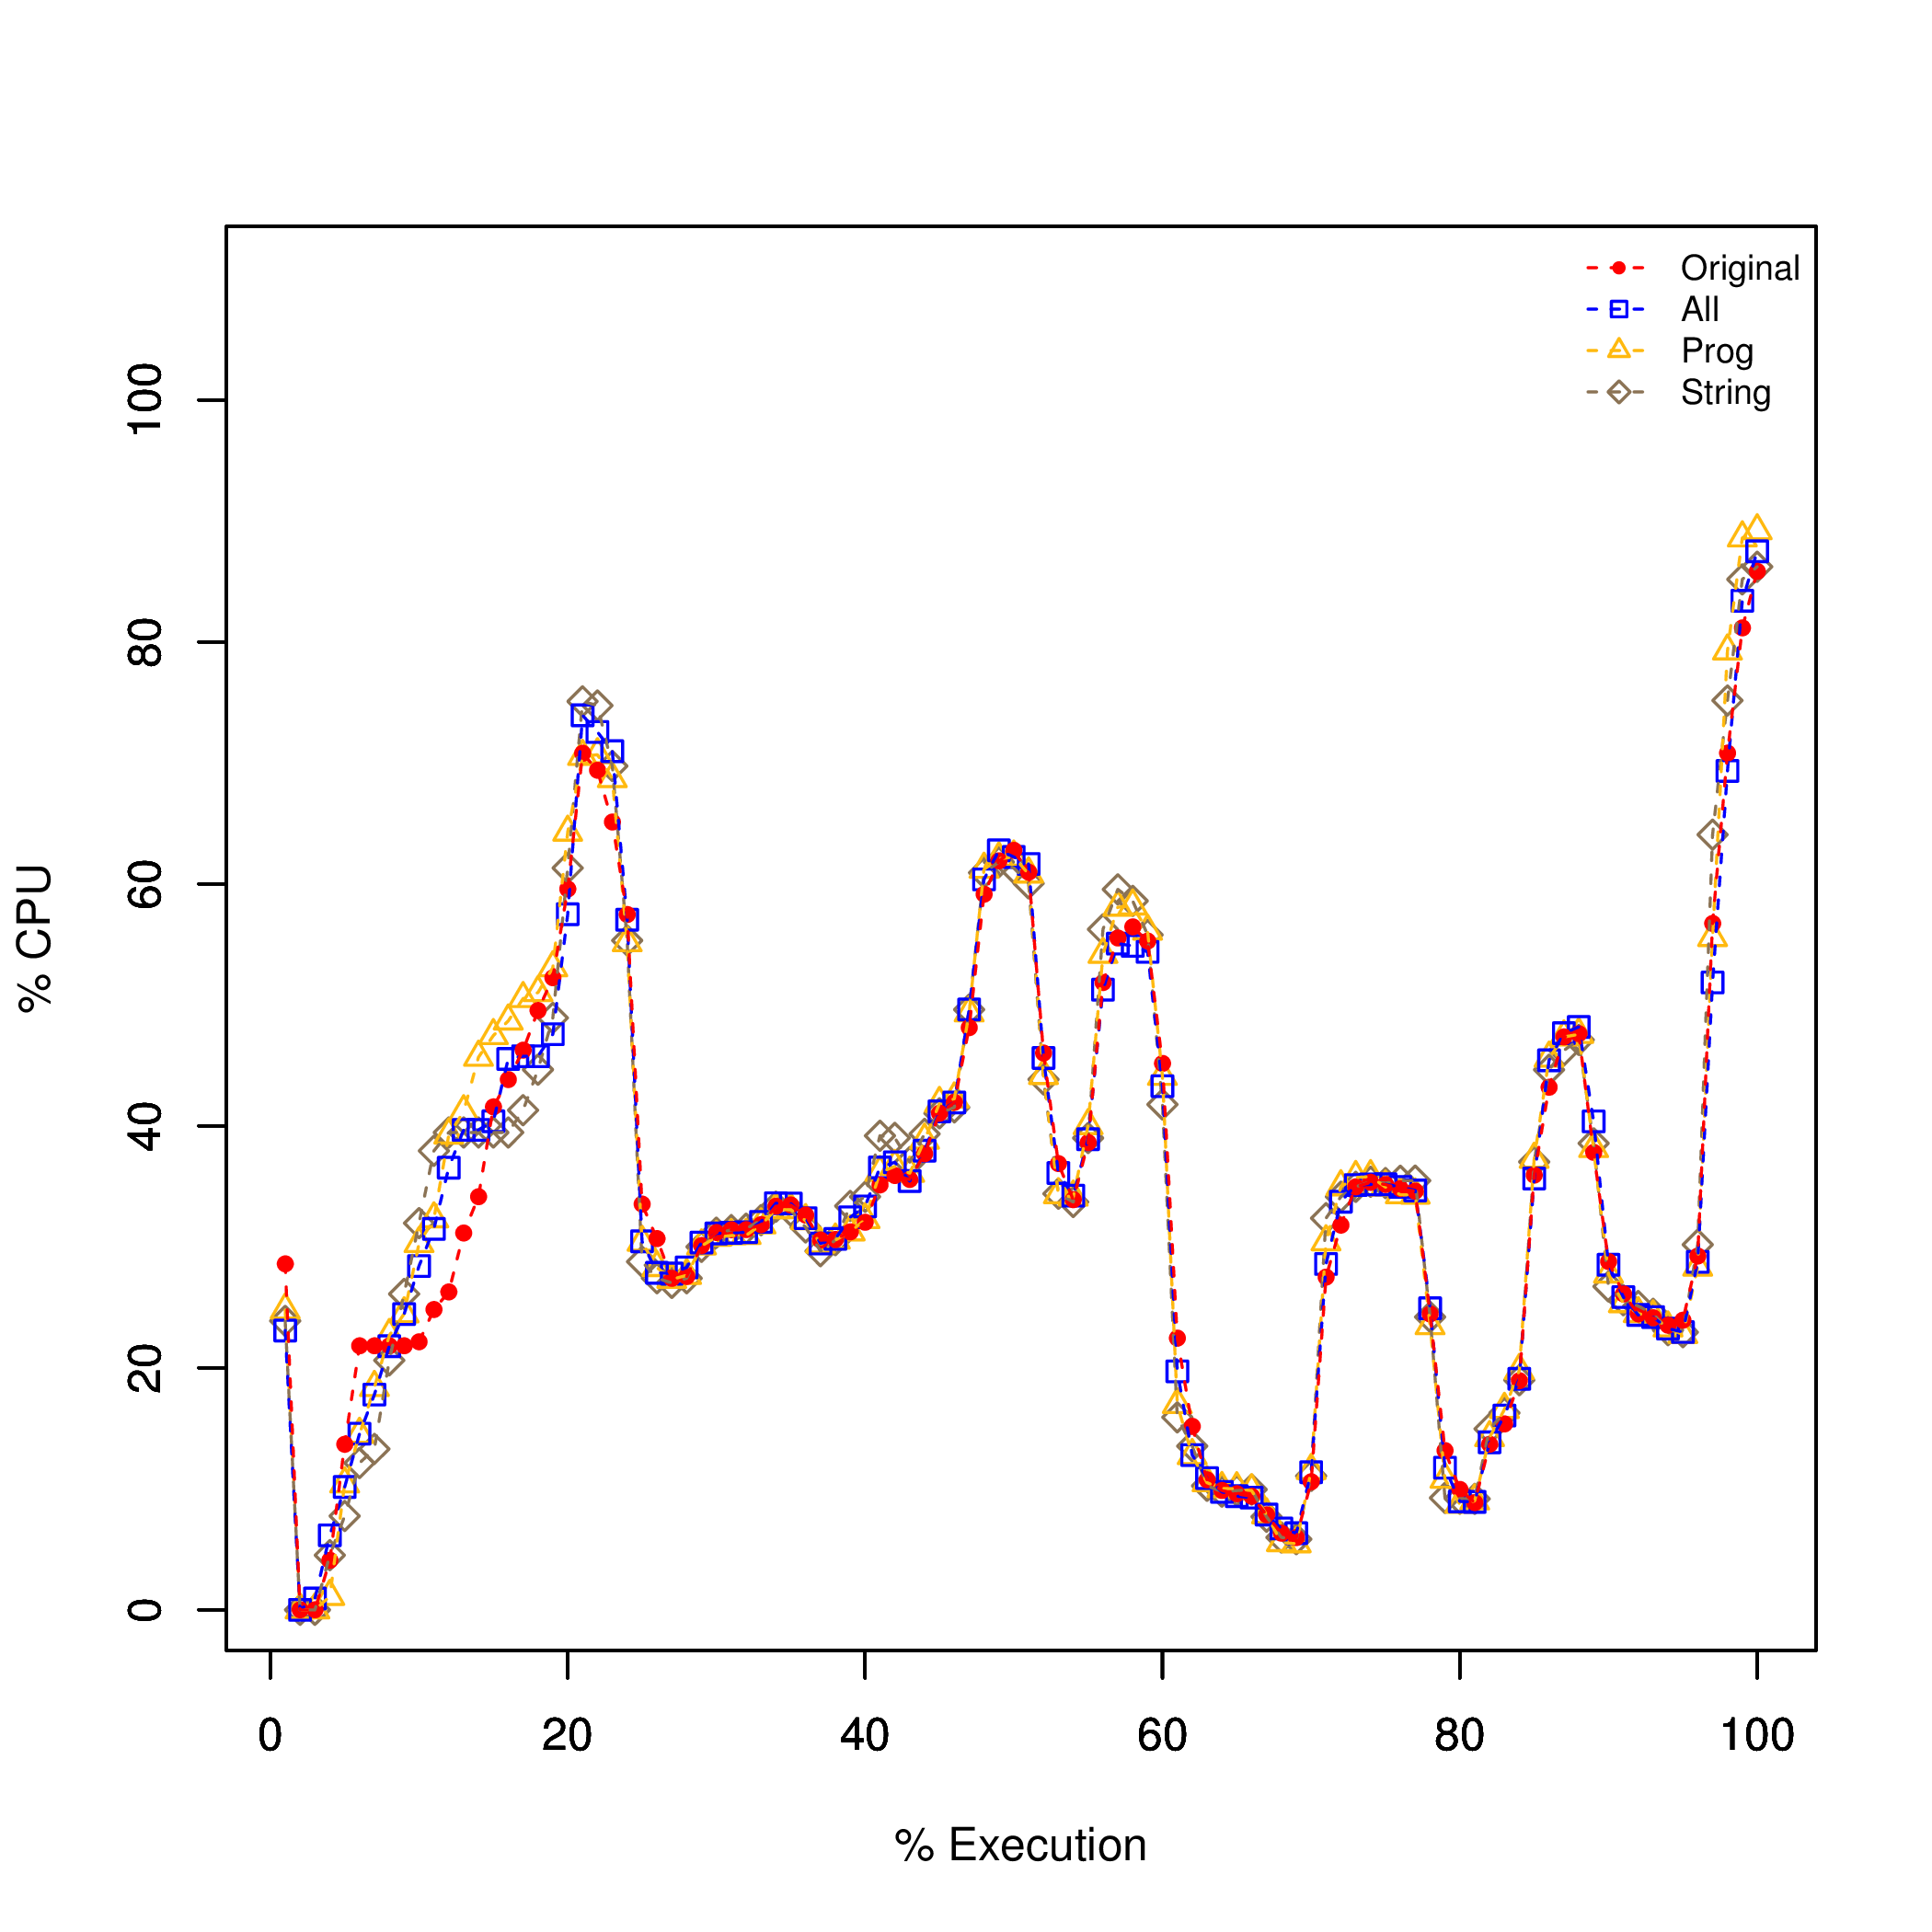
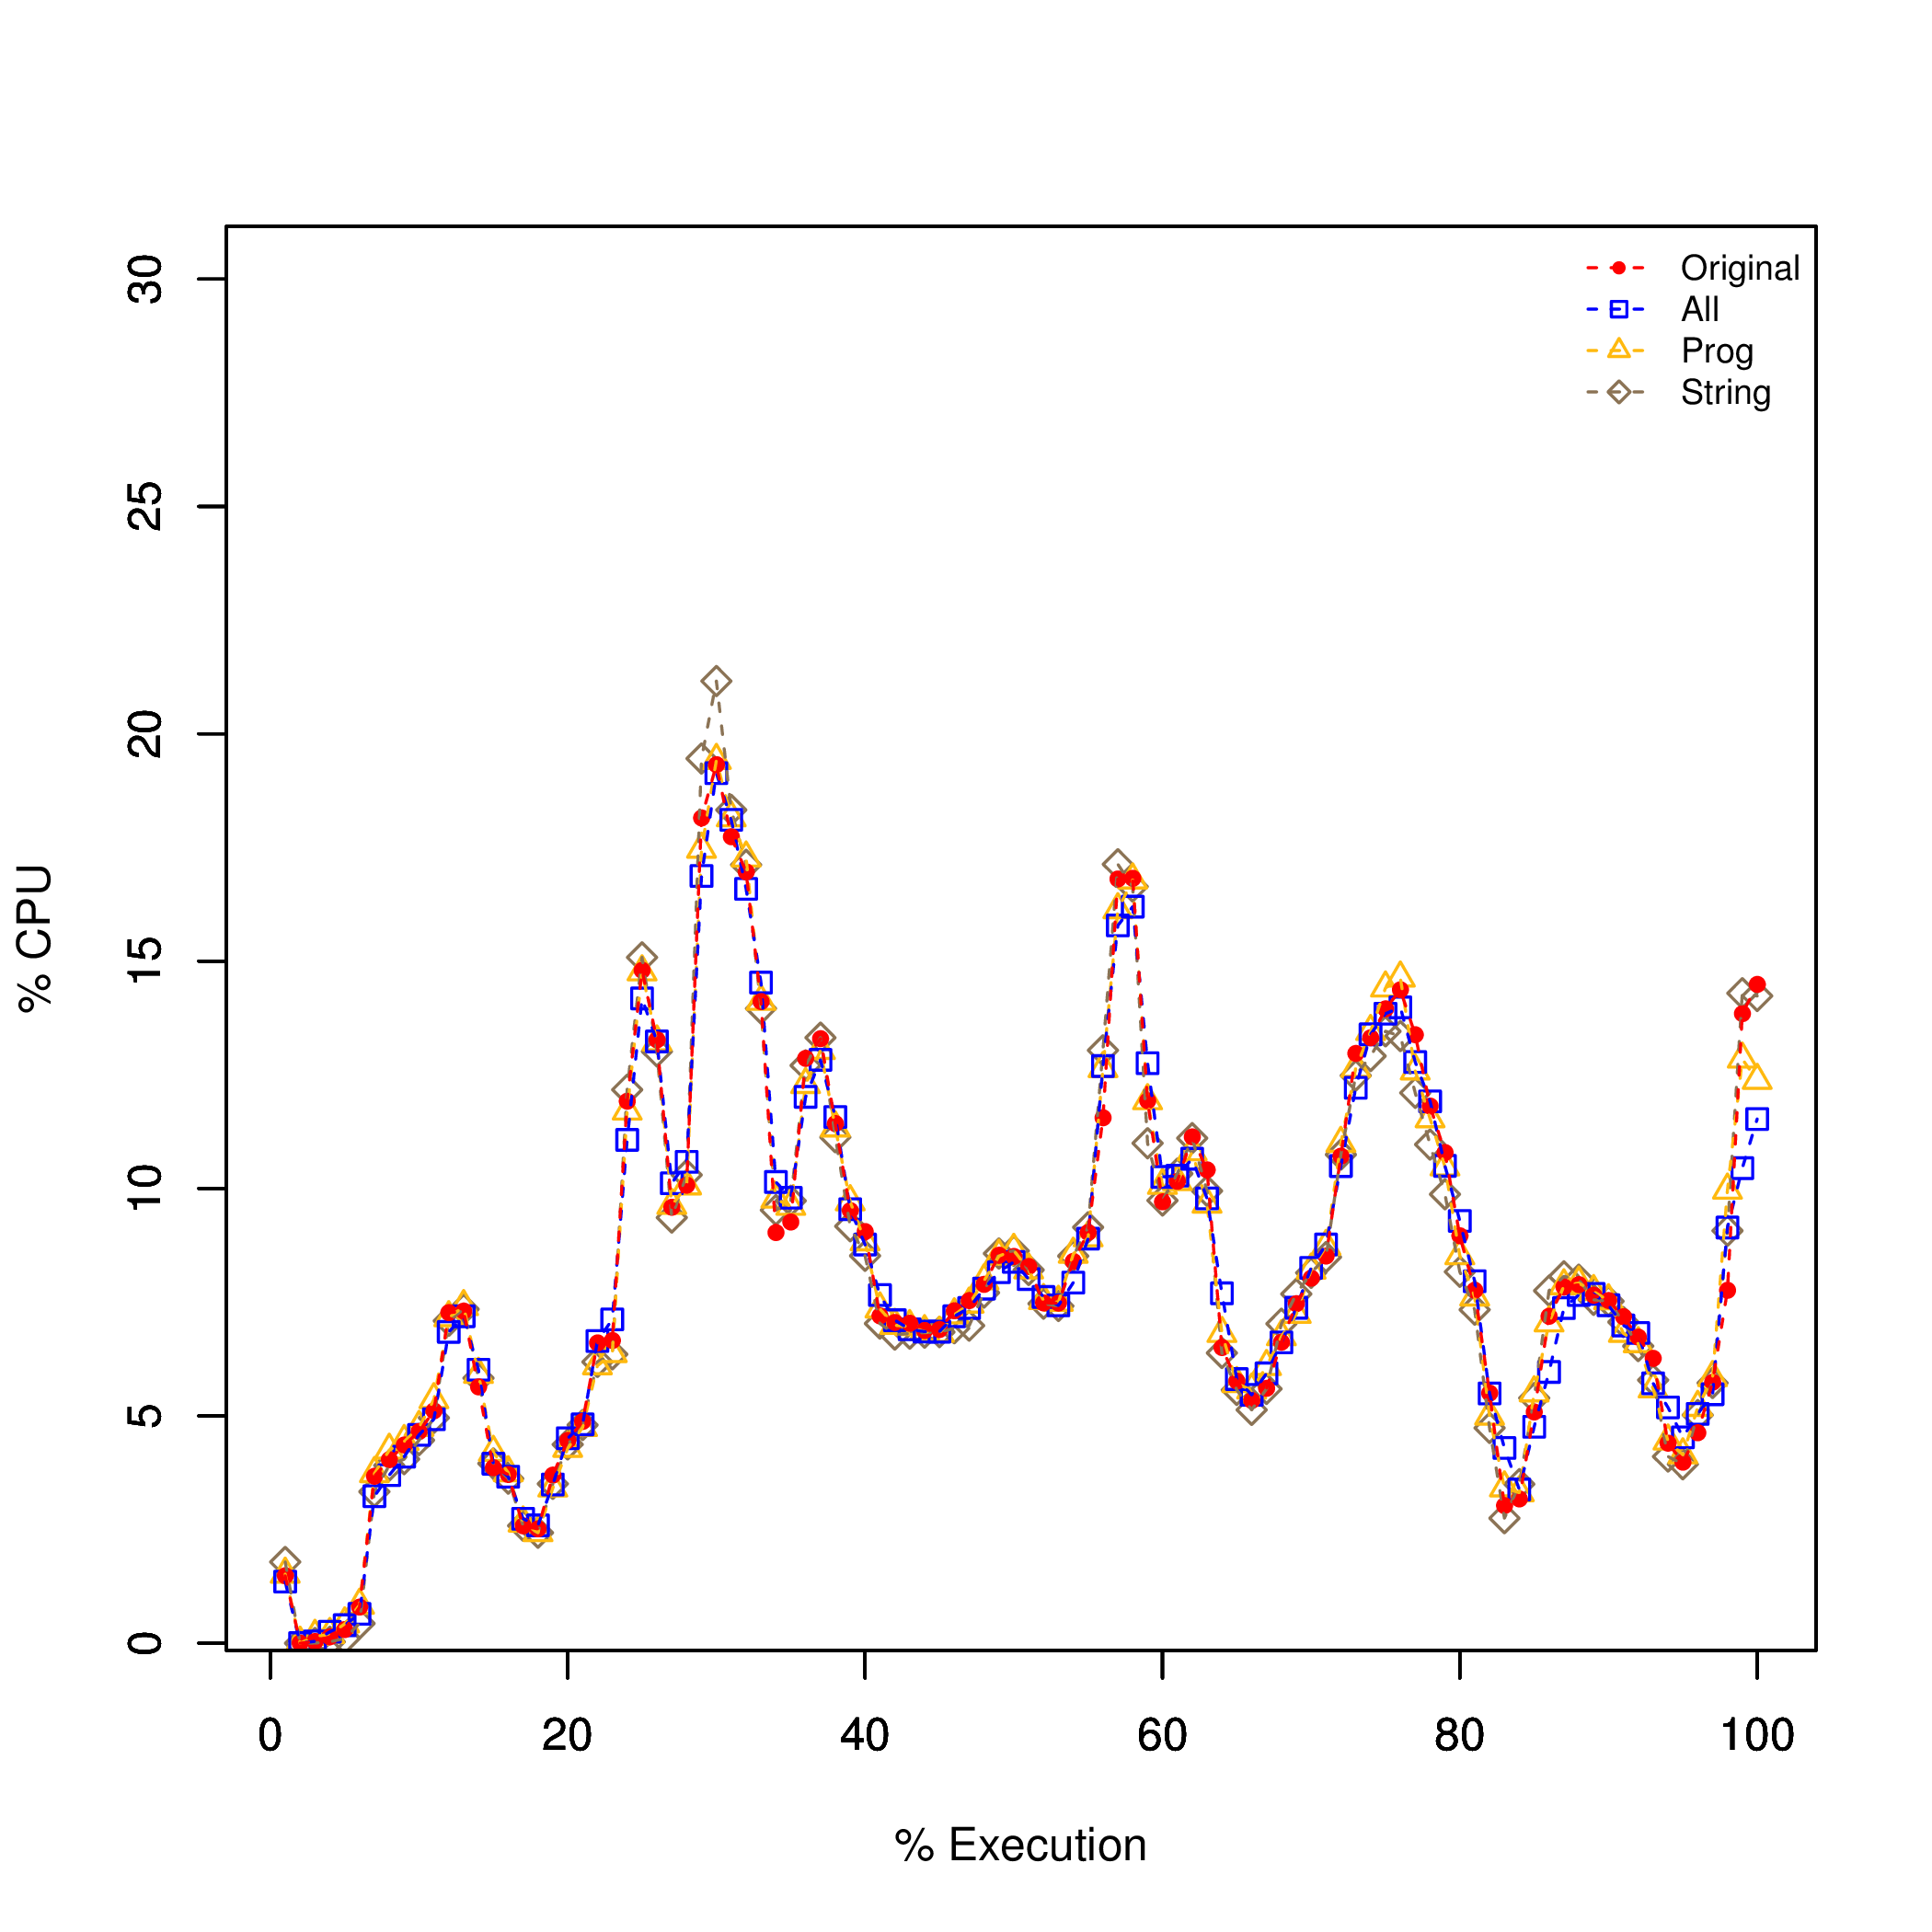
CPU - Traces
 |
 |
| Ancal | AndroidBicycle |
 |
 |
| Hangeulider | HealthFoodConcepts |
 |
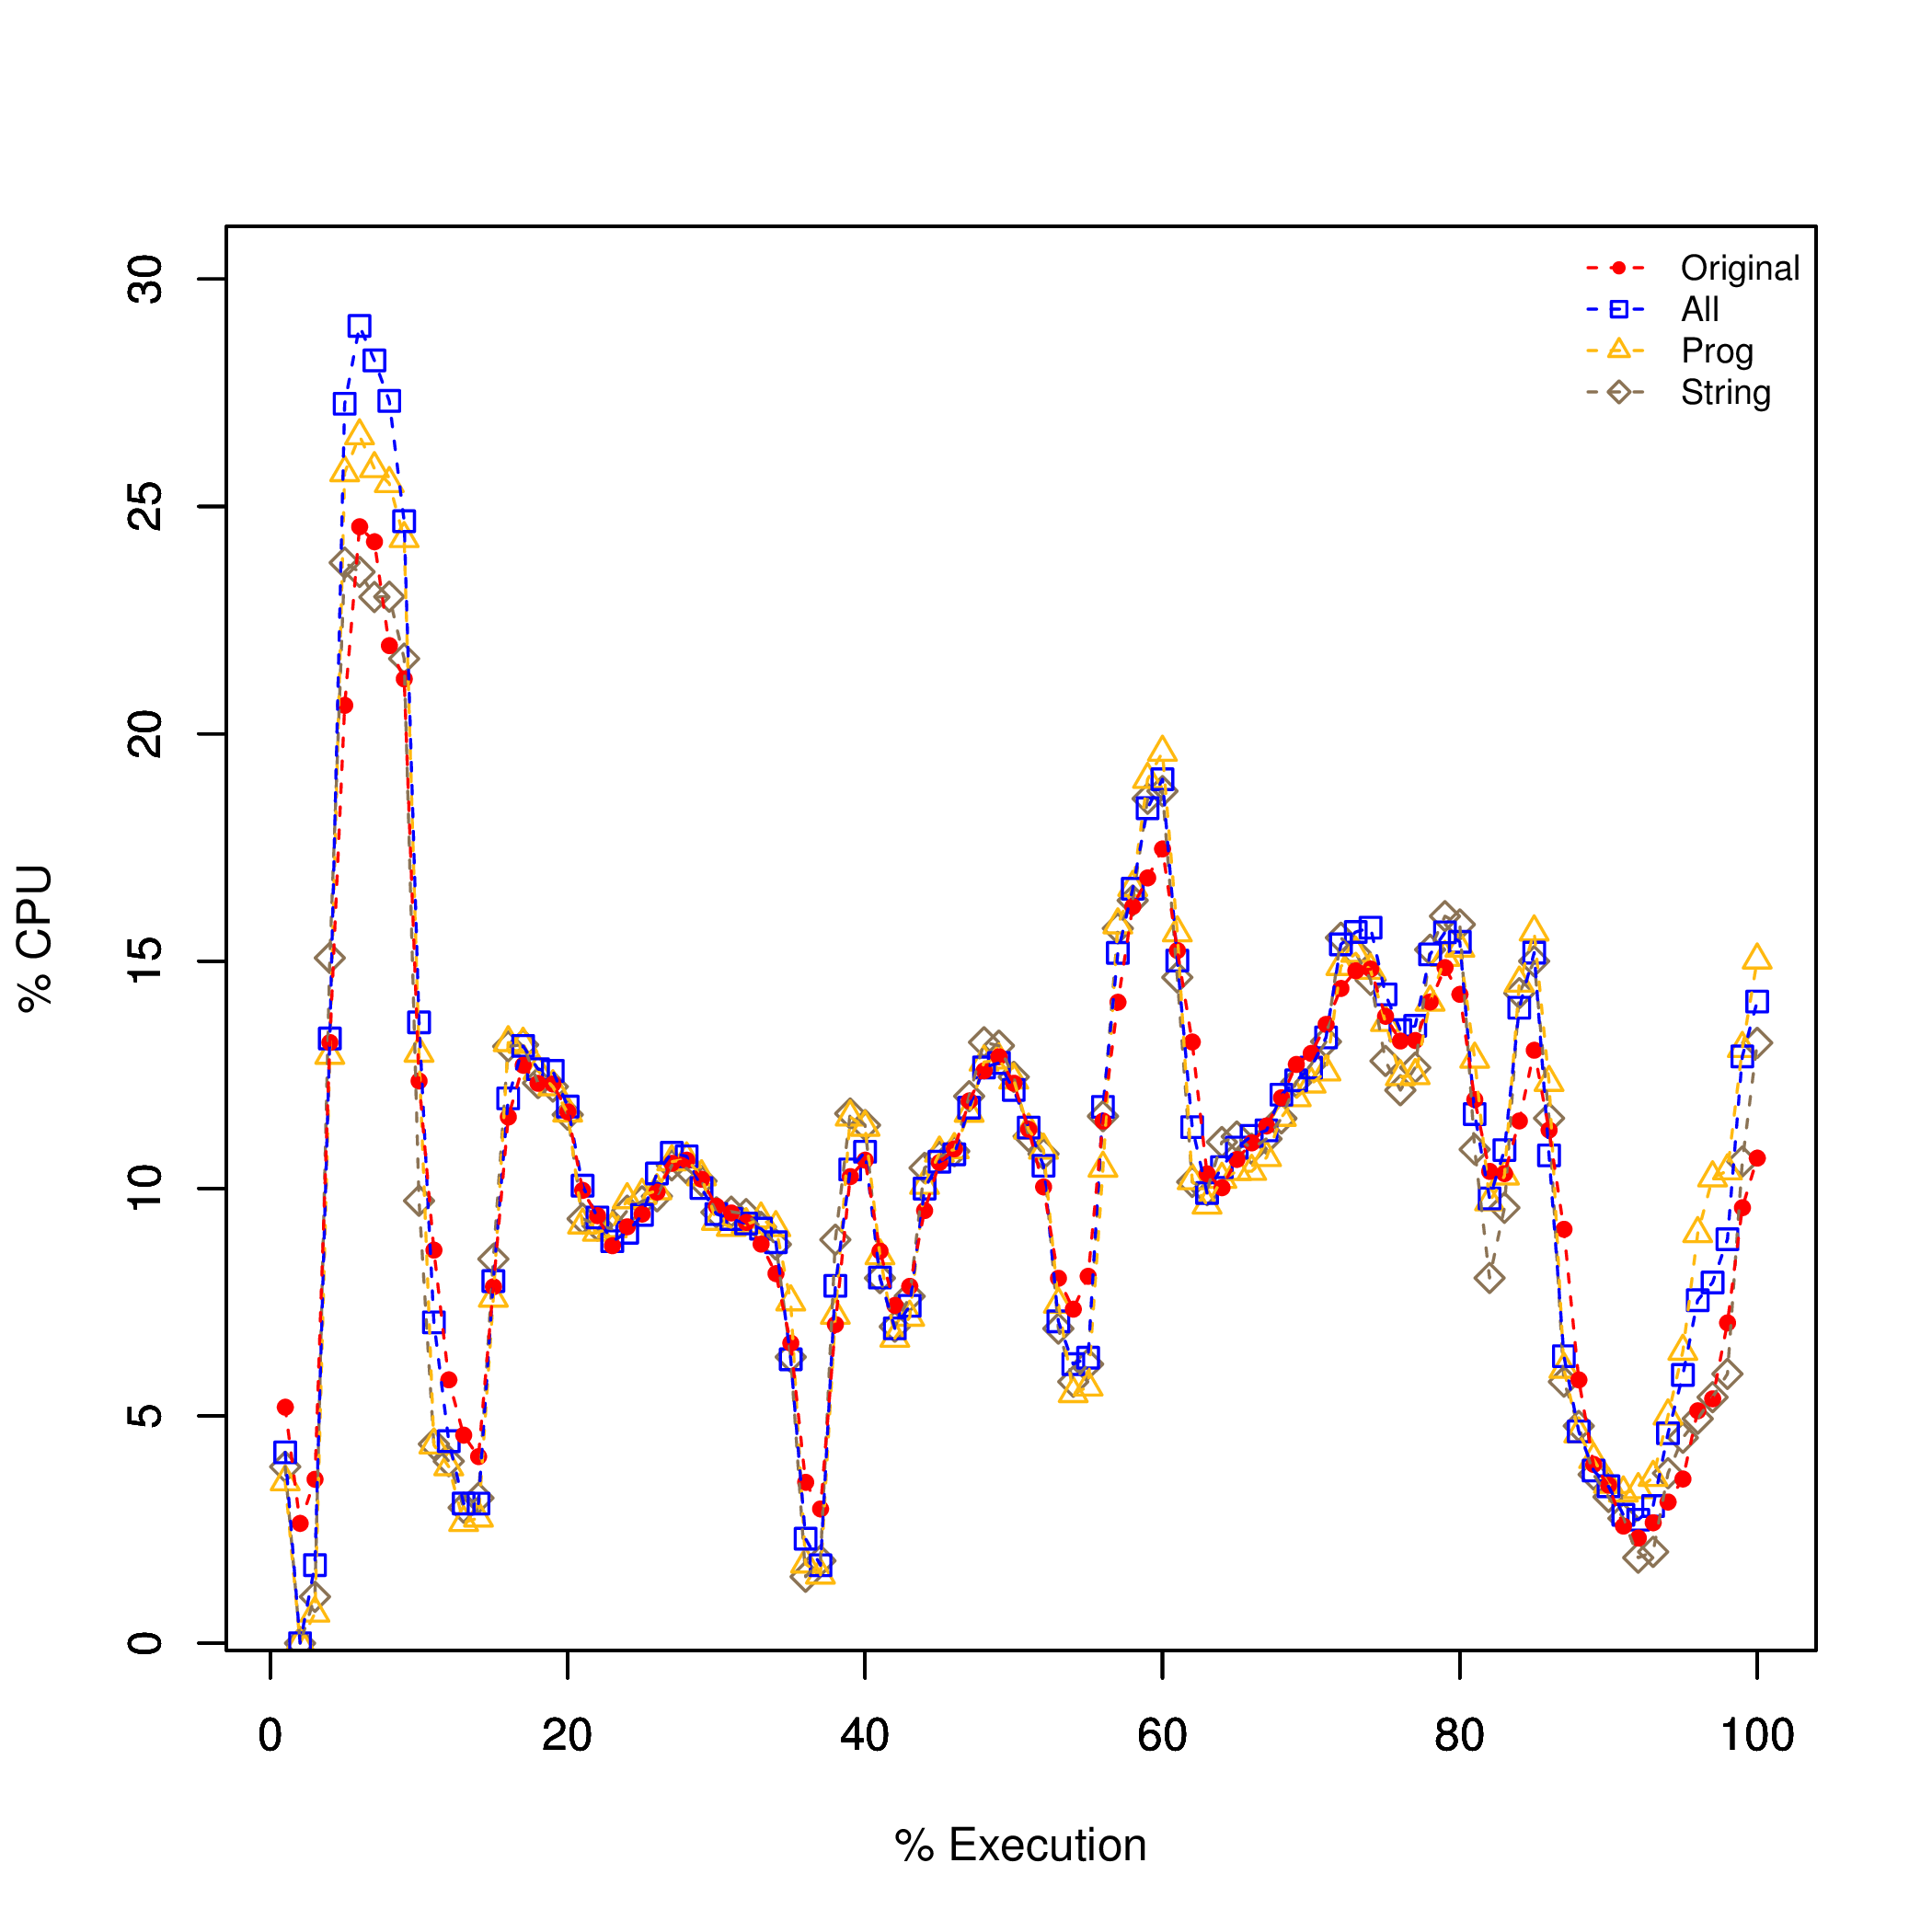 |
| evaSppA | RaspberryBusMalaysia |
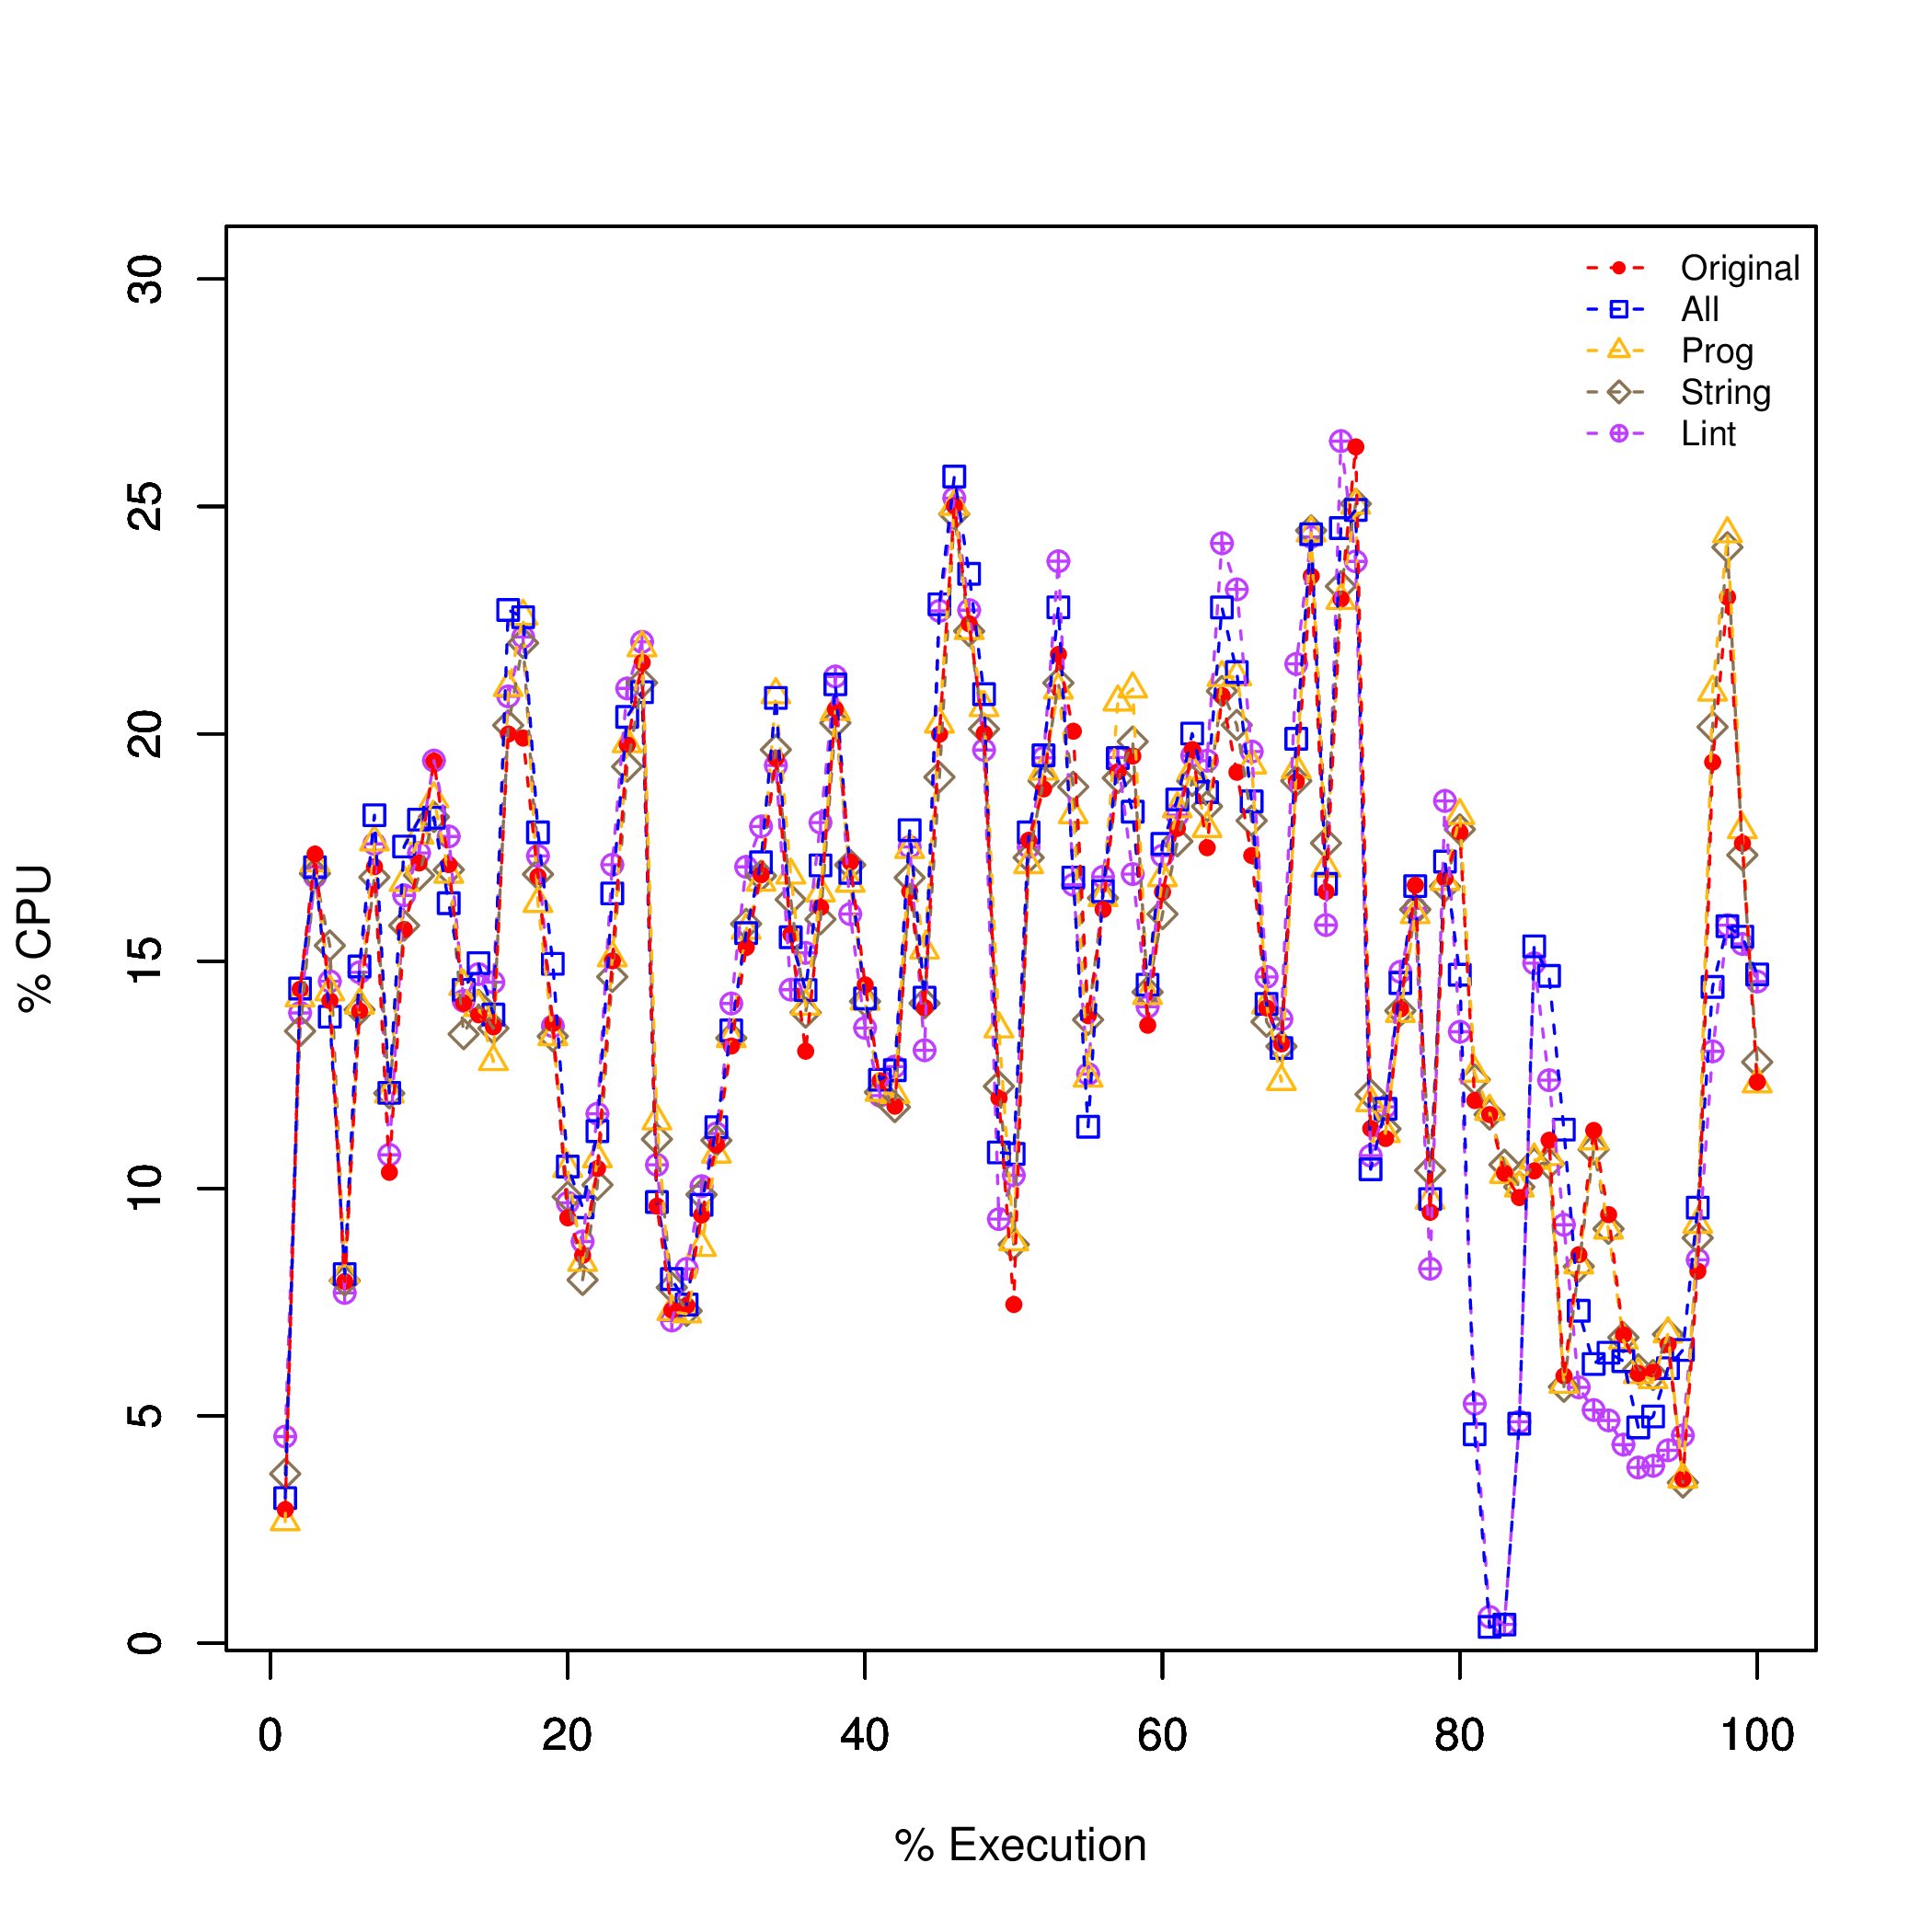 |
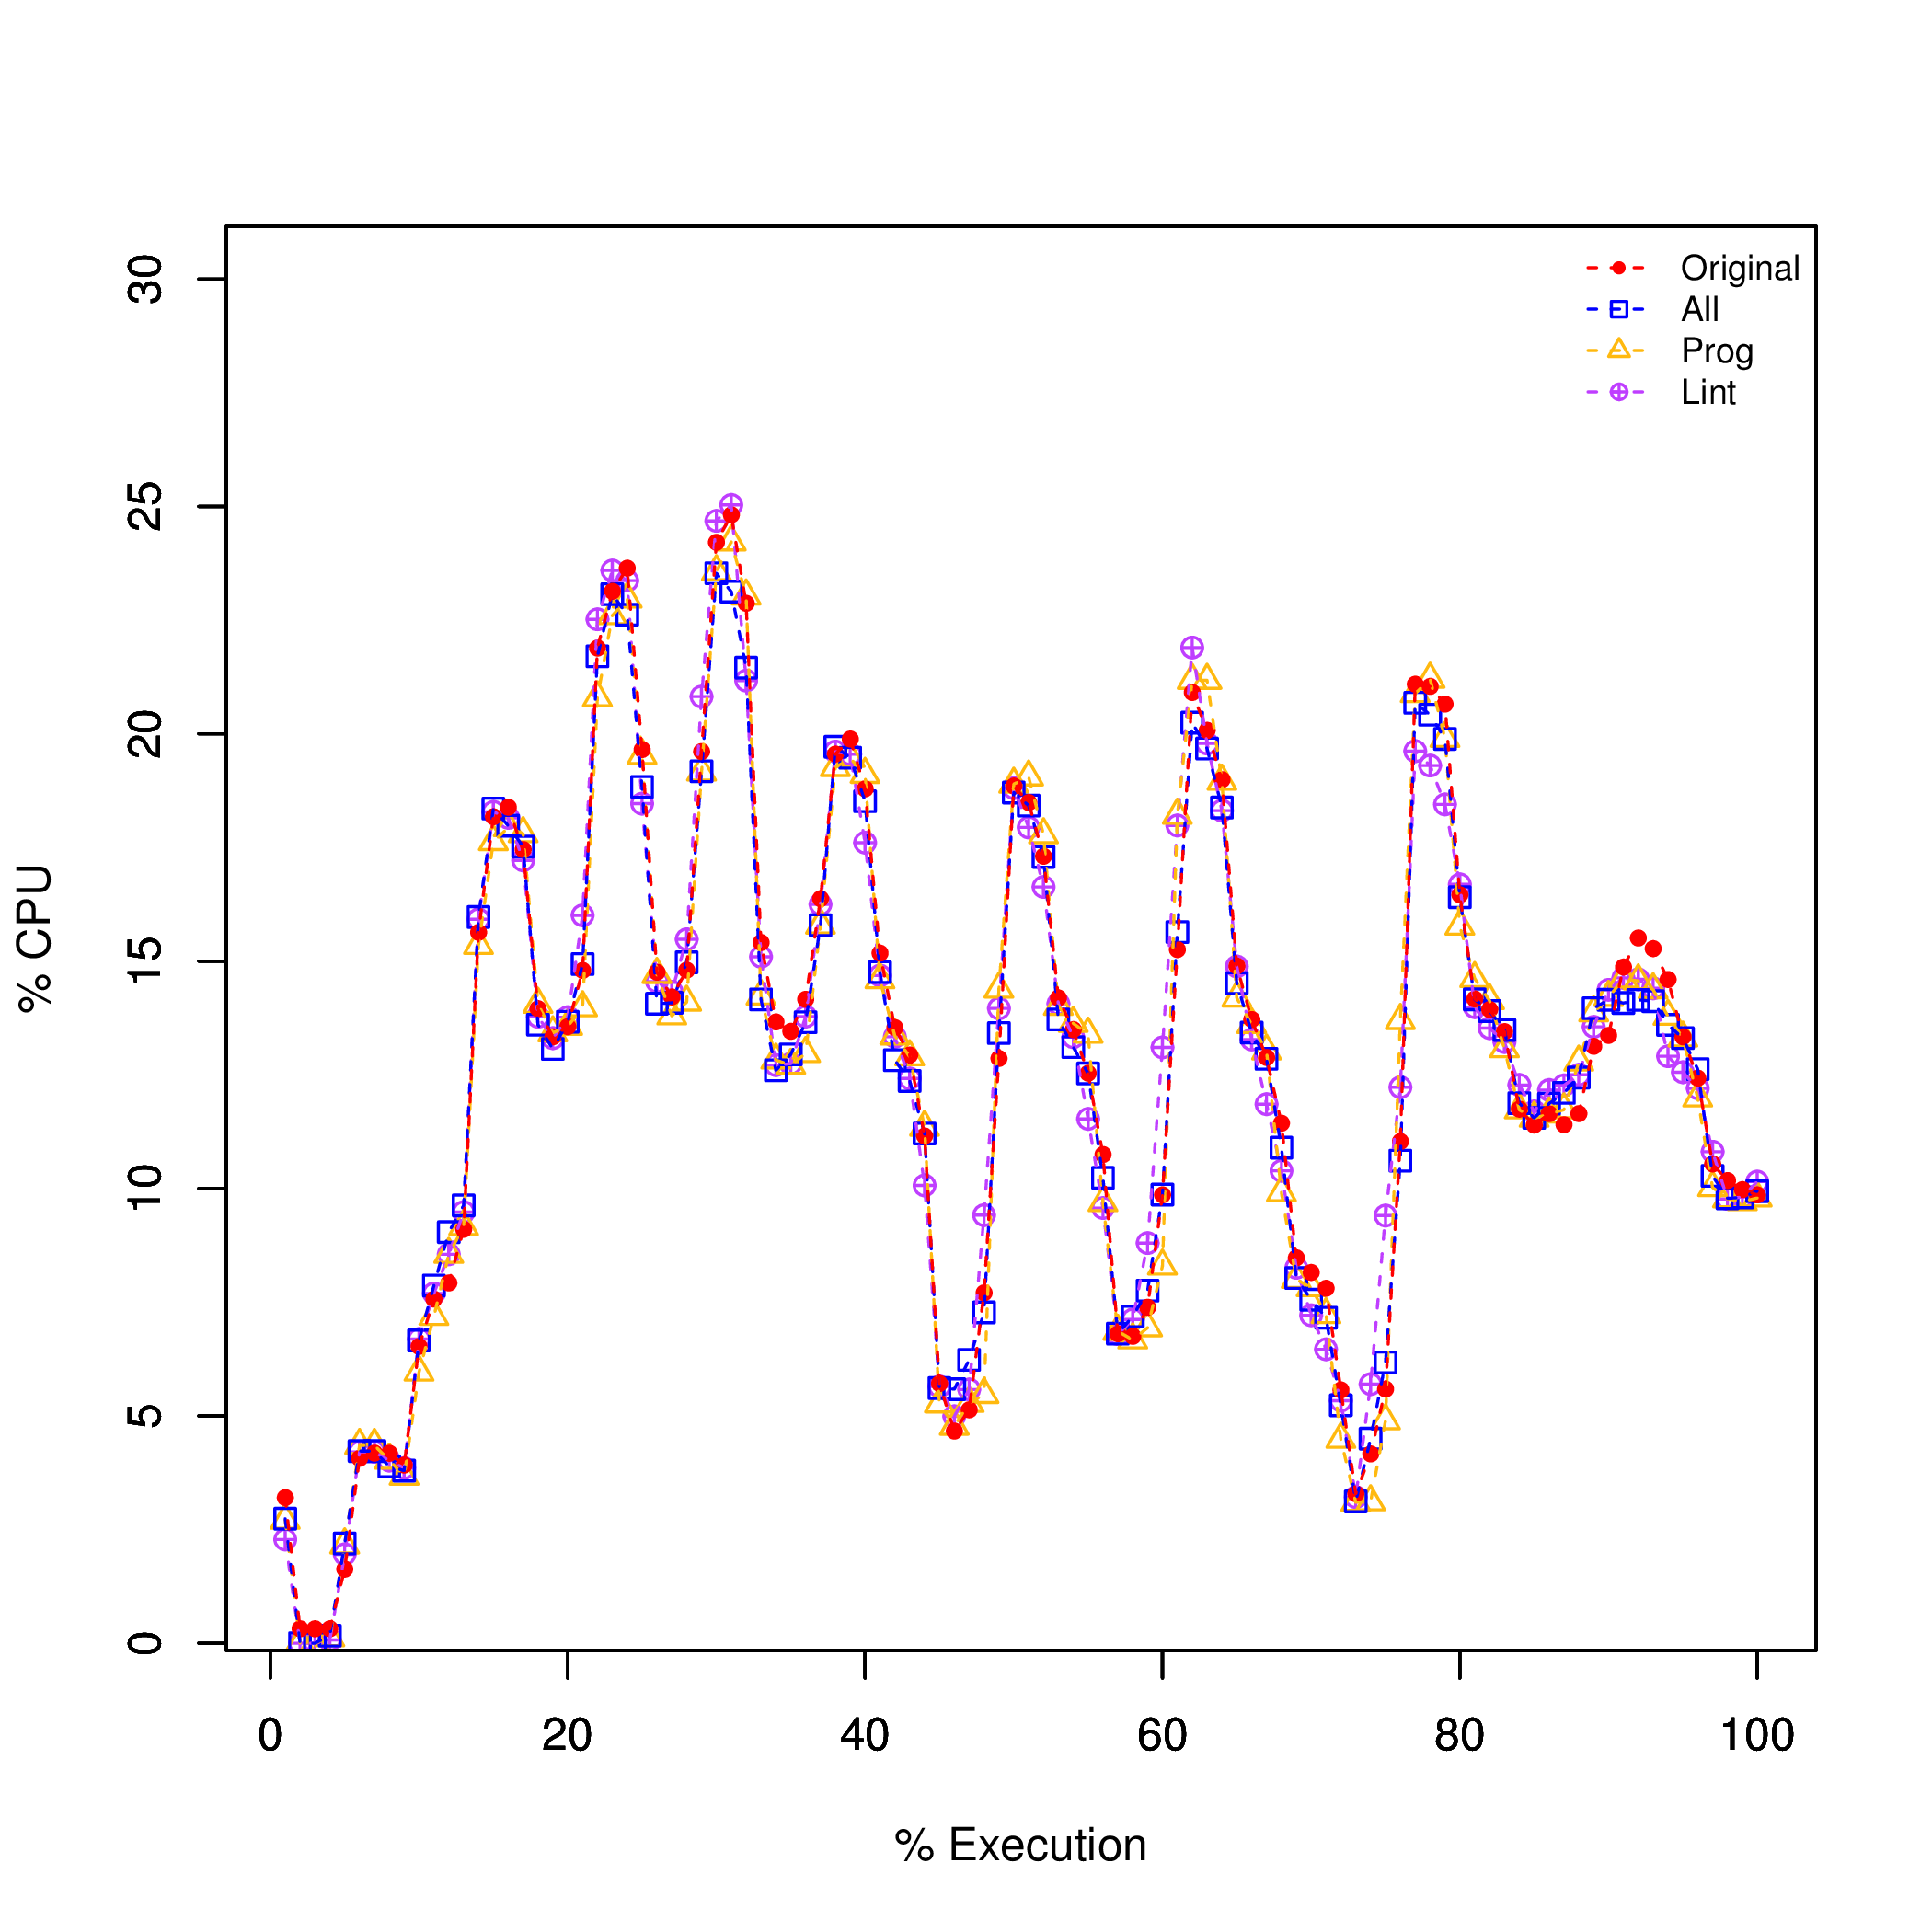 |
| Subsonic-Android | HeartsSky |
Memory - MinUSS
Memory - AvgUSS
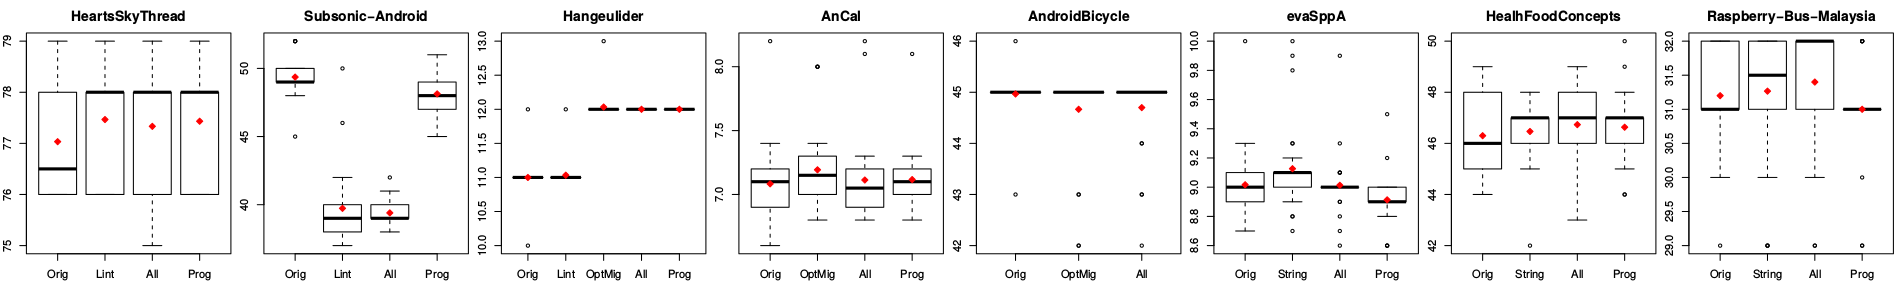
Memory - MaxUSS
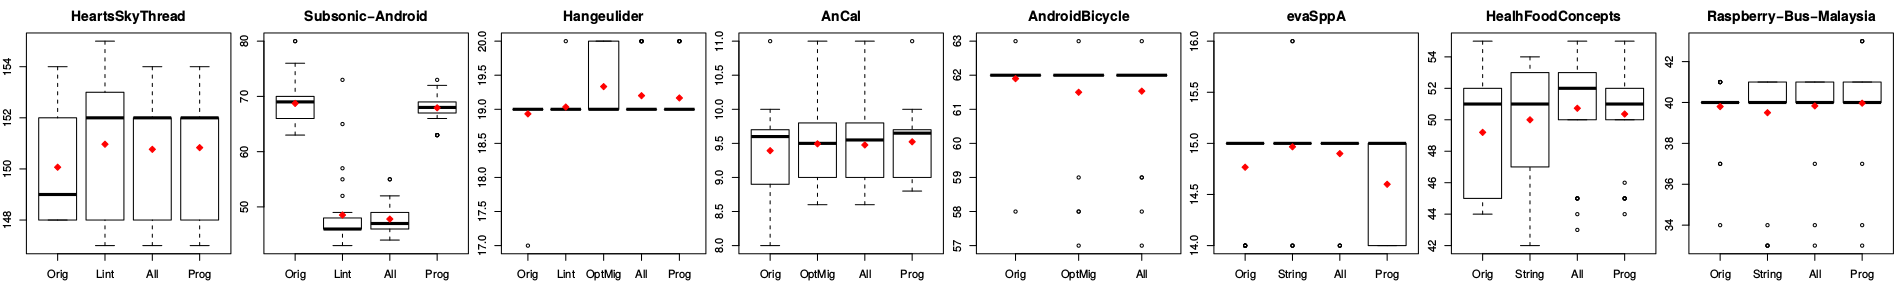
Memory - MinPSS
Memory - AvgPSS
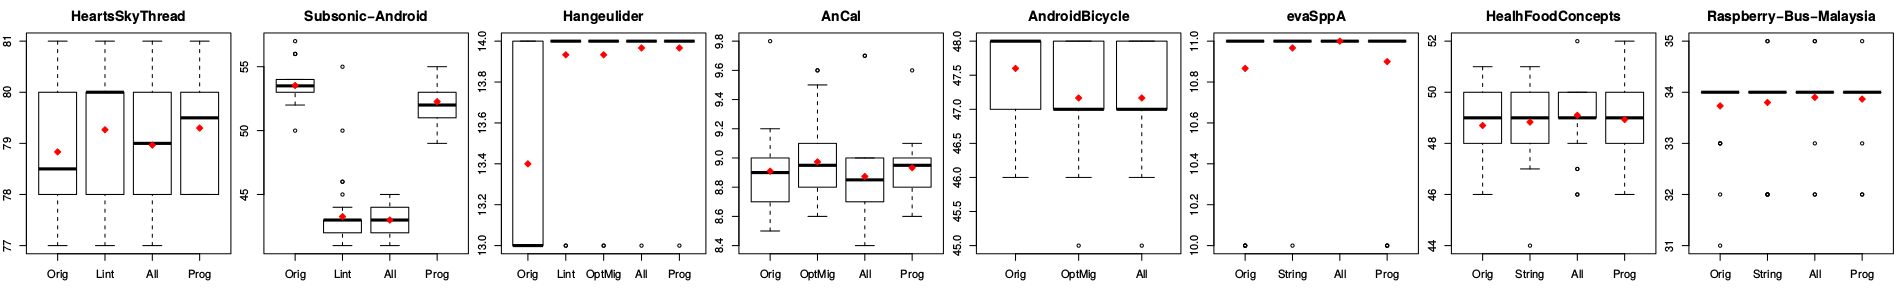
Memory - MaxPSS
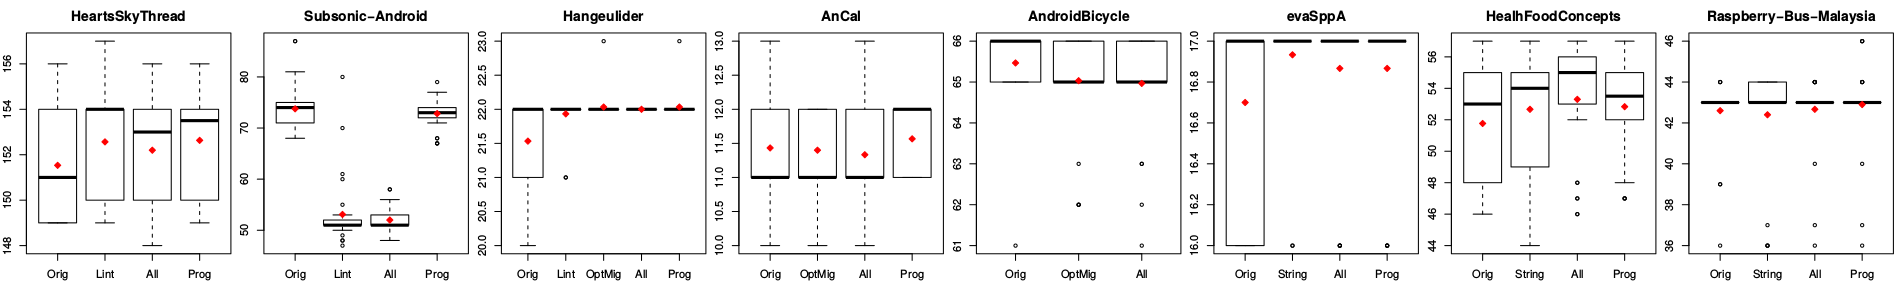
This link provides all the boxplots in PDF format and the R scripts used to generate them.
Statistical Tests
This link provides the following data regarding the Statistical Tests we performed:- Statistical Tests Results
- for Single App
- Aggregated for Measurement Metric
- R Scripts
RQ4: Practices for Detecting Optimization Opportunities
Taxonomy of practices
Taxonomy of practices for detecting optimization opportunities. Dynamic analysis-based techniques are marked with (D), and static analysis-based ones with (S). The percentage of participants using the technique is also listed| Category | Technique | Description |
|---|---|---|
| Direct observation (D) | Testing (21.18%) | Manual/automatic execution aimed at detecting hot-spots by using common sense and personal judgment |
| Debugging (2.12%) | Manual execution in step-by-step mode with breakpoints and detection of hot-spots by using common sense | |
| LogCat analysis (2.35%) | Manual/automatic execution and analysis of the information available in the Android LogCat such us garbage collection, dropped frames, etc. | |
| GUI analysis (1.65%) | Manual/automatic execution and analysis of inefficient draw calls, excessive nesting, unused components. | |
| Data analysis- based (D) | TProfiling (24.94%) | Resource-related measurements are collected using a profiler and analyzed in runtime |
| Benchmarking (1.41%) | Performance of a target app is evaluated with a set of conditions or compared to a set of apps belonging to a benchmark | |
| Monitoring (0.94%) | Same than profiling, but the profiling is done online meanwhile the app is used by real users. | |
| Policy-based (D) | Android StrictMode (0.71%) | Android specific instrumentation, in which policies are defined via API and the policies’ violations are detected by the framework in runtime |
| Post-mortem (D) | Reviews/Bug reports (4.94%) | The optimization opportunities are detected by users and reported as bugs or requests for improvements via user reviews or bug reports |
| Crash analysis (1.88%) | Crashes are collected online in runtime, then the reports are analyzed to detect performance issues | |
| Code analysis (S) | Code reviews (8.95%) | Source code is inspected manually |
| Lint (3.53%) | Source code is inspected by using the Android Lint tool | |
| Analysis (0.47%) | Analysis of algorithm techniques are used to estimate time and memory | |
| Documents (S) | Crowd-based (2.59%) | Participants look for advice on forums, developer groups, documentation, etc. |
| Prevention (S) | Best practices (4.71%) | Good programming/design practices, acquired mostly by experience |
| Native code (1.18%) | Usage of native code and reduction of the dependency in Android API | |
| Libraries (0.24%) | Participants rely on open source libraries to reduce risk of optimization issues | |
| Latest API (0.24%) | Usage of the latest version of the Android API is considered to prevent optimization issues |
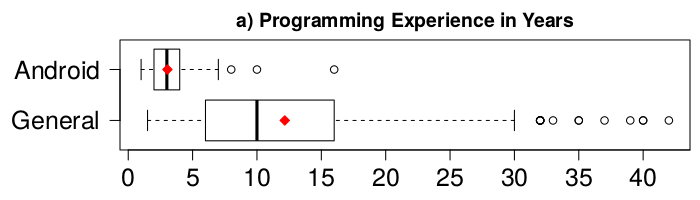
RQ5: Micro-optimizations Recognized (and Used) by Developers as Useful for Improving the Performance of Apps
Number of participants with successful applications of micro-optimizations to improve performance
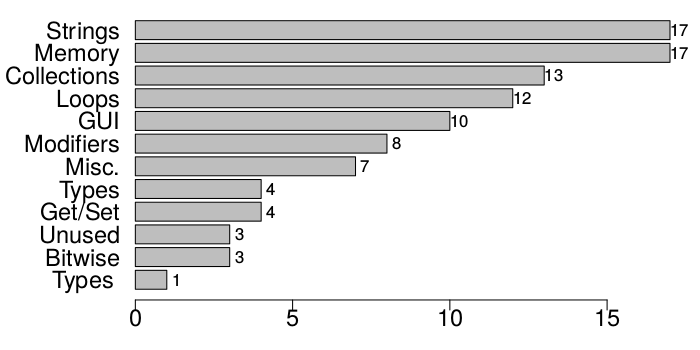
This link provides the above plots in PDF format.
Raw data can be made available upon request by emailing the authors
Authors
- Mario Linares-Vásquez
- Universidad de los Andes, Bogotá, Colombia.
E-mail: mlinarev at uniandes dot edu dot co - Christopher Vendome
- The College of William and Mary, VA, USA.
E-mail: cvendome at cs dot wm dot edu - Michele Tufano
- The College of William and Mary, VA, USA.
E-mail: mtufano at cs dot wm dot edu - Denys Poshyvanyk
- The College of William and Mary.
E-mail: denys at cs dot wm dot edu