How Do Static and Dynamic Test Case Prioritization Techniques Perform on Modern Software Systems? A Large-Scale Study on GitHub Projects
- TSE 2017 Online Appendix
This web page is a companion to our TSE 2017 submission entitled "How Do Static and Dynamic Test Case Prioritization Techniques Perform on Modern Software Systems? A Large-Scale Study on GitHub Projects".
1. Studied TCP techniques
We conducted our empirical study on four static TCP techniques and four dynamic techniques.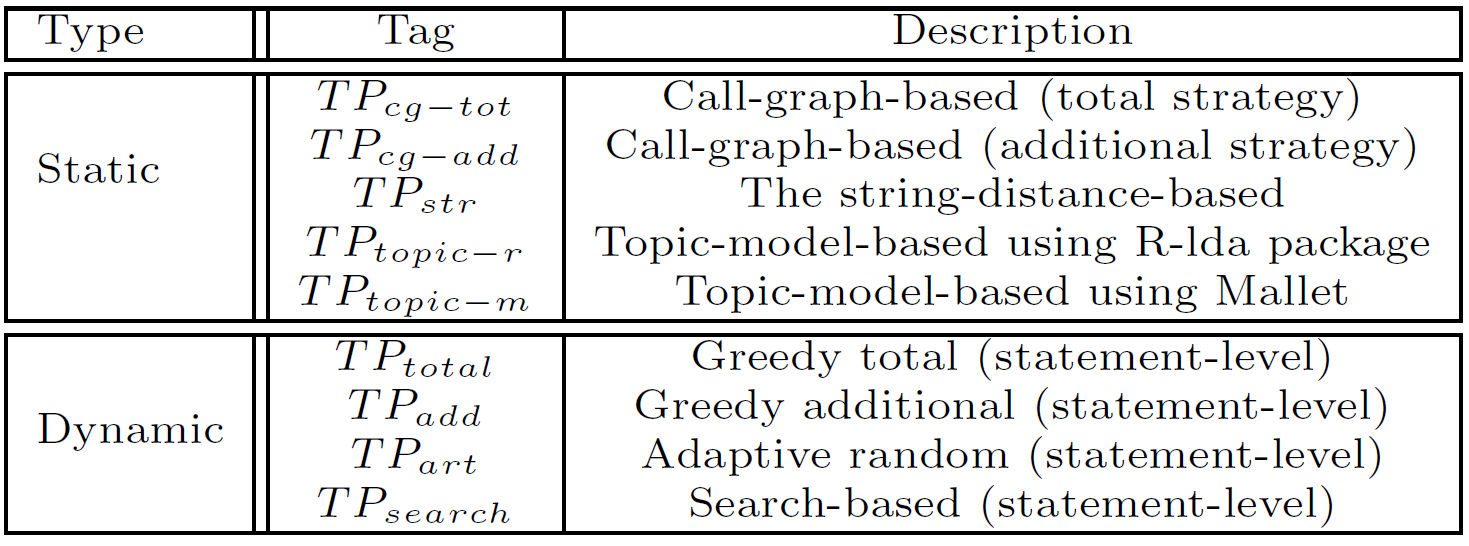
2. Subject programs
We collected 58 large, real-world Java systems. The programs names, links and sizes in terms of lines of code (LOC) are shown in the following table. The numbers of test cases on method level and class level are shown in Columns 4 and 5 respectively. Columns 6 and 7 show the number of mutation faults that can be detected and the the number of all mutation faults for each subject.| Subjects & Links | Version | #LOC | #TM | #TC | Detected | All |
| P1-geojson-jackson(Link) | f4c606 | 1,151 | 44 | 13 | 301 | 717 |
| P2-statsd-jvm-profiler(Link) | 73ba39 | 1,355 | 29 | 12 | 290 | 708 |
| P3-stateless4j(Link) | ec3b30 | 1,756 | 61 | 10 | 392 | 696 |
| P4-jarchivelib(Link) | 563b7c | 1,940 | 22 | 12 | 655 | 948 |
| P5-JSONassert(Link) | ce4eeb | 1,957 | 121 | 10 | 935 | 1,116 |
| P6-java-faker(Link) | 01c77a | 2,069 | 28 | 11 | 392 | 600 |
| P7-jackson-datatype-joda(Link) | bb552d | 2,409 | 57 | 8 | 675 | 1,212 |
| P8-Java-apns(Link) | 2665ef | 3,234 | 87 | 15 | 412 | 1,122 |
| P9-pusher-websocket-java(Link) | fdb4ad | 3,259 | 199 | 11 | 851 | 1,470 |
| P10-gson-fire(Link) | 6ac258 | 3,421 | 55 | 14 | 847 | 1,064 |
| P11-jackson-datatype-guava(Link) | a049b9 | 3,994 | 91 | 15 | 313 | 1,832 |
| P12-dictomaton(Link) | c3ef36 | 4,099 | 53 | 11 | 2,024 | 10,857 |
| P13-jackson-uuid-generator(Link) | 487289 | 4,158 | 45 | 6 | 802 | 2,039 |
| P14-JAdventure(Link) | 3784cf | 4,416 | 35 | 10 | 738 | 5,098 |
| P15-exp4j(Link) | 2c7795 | 4,617 | 285 | 9 | 1,365 | 1,563 |
| P16-jumblr(Link) | 68fa79 | 4,623 | 103 | 15 | 610 | 1,192 |
| P17-efflux(Link) | 264221 | 4,940 | 41 | 10 | 1,190 | 2,840 |
| P18-metrics-core(Link) | d83b98 | 5,027 | 144 | 28 | 1,656 | 5,265 |
| P19-low-gc-membuffers(Link) | febe59 | 5,198 | 51 | 18 | 1,861 | 3,654 |
| P20-xembly(Link) | 05101d | 5,319 | 58 | 16 | 1,190 | 2,546 |
| P21-scribe-java(Link) | 0311a4 | 5,355 | 99 | 18 | 563 | 1,622 |
| P22-jpush-api-java-client(Link) | 7aedcb | 5,462 | 65 | 10 | 822 | 2,961 |
| P23-gdx-artemis(Link) | 1687eb | 6,043 | 31 | 20 | 968 | 1,687 |
| P24-Protoparser(Link) | 8be66b | 6,074 | 171 | 14 | 3,346 | 4,640 |
| P25-commons-cli(Link) | b486fb | 6,601 | 317 | 26 | 2,362 | 2,801 |
| P26-mp3agic(Link) | 99fa15 | 6,939 | 205 | 19 | 3,362 | 6,391 |
| P27-webbit(Link) | f628a7 | 7,363 | 131 | 25 | 1,268 | 3,833 |
| P28-RestFixture(Link) | bb4c70 | 7,421 | 268 | 30 | 2,234 | 3,278 |
| P29-LastCalc(Link) | 7e0fc9 | 7,707 | 34 | 13 | 2,814 | 6,635 |
| P30-jackson-dataformat-csv(Link) | a4c104 | 7,850 | 98 | 27 | 1,693 | 6,795 |
| P31-skype-java-api(Link) | a7df1a | 8,264 | 24 | 16 | 885 | 6,494 |
| P32-lambdaj(Link) | bd3afc | 8,510 | 252 | 35 | 3,382 | 4,341 |
| P33-jackson-dataformat-xml(Link) | a1ab20 | 8,648 | 134 | 45 | 1,706 | 4,149 |
| P34-jopt-simple(Link) | a16d86 | 8,778 | 511 | 79 | 2,325 | 2,525 |
| P35-jline2(Link) | 8d6c53 | 8,783 | 130 | 16 | 3,523 | 8,368 |
| P36-javapoet(Link) | 1a1694 | 9,007 | 246 | 16 | 3,400 | 4,601 |
| P37-Liqp(Link) | 54f9bd | 9,139 | 235 | 58 | 7,962 | 18,608 |
| P38-cassandra-reaper(Link) | ef76a2 | 9,896 | 40 | 12 | 1,186 | 5,105 |
| P39-JSqlParser(Link) | a0e372 | 10,335 | 313 | 19 | 15,698 | 32,785 |
| P40-raml-java-parser(Link) | 6b6916 | 11,126 | 190 | 36 | 4,678 | 6,431 |
| P41-redline-smalltalk(Link) | 6322ac | 11,228 | 37 | 9 | 1,834 | 10,763 |
| P42-user-agent-utils(Link) | ecc991 | 11,456 | 62 | 7 | 376 | 688 |
| P43-javaewah(Link) | 558ab0 | 13,293 | 229 | 11 | 6,307 | 11,939 |
| P44-jsoup-learning(Link) | 2c0580 | 13,505 | 380 | 25 | 7,761 | 13,230 |
| P45-wsc(Link) | a0ab08 | 13,652 | 16 | 8 | 1,687 | 17,942 |
| P46-rome(Link) | 772d4f | 13,874 | 443 | 45 | 4,920 | 10,744 |
| P47-JActor(Link) | 204739 | 14,171 | 54 | 43 | 132 | 1,375 |
| P48-RoaringBitmap(Link) | 13038a | 16,341 | 286 | 15 | 9,709 | 13,574 |
| P49-JavaFastPFOR(Link) | 2dd09c | 17,695 | 42 | 8 | 46,429 | 64,372 |
| P50-jprotobuf(Link) | e4ee6e | 21,161 | 48 | 18 | 1,539 | 10,338 |
| P51-worldguard(Link) | 323413 | 24,457 | 148 | 12 | 1,127 | 25,940 |
| P52-commons-jxpath(Link) | e48043 | 24,910 | 411 | 39 | 13,611 | 24,369 |
| P53-commons-io(Link) | c49315 | 27,263 | 1125 | 92 | 7,630 | 110,365 |
| P54-nodebox(Link) | 2717b3 | 32,244 | 293 | 40 | 7,824 | 36,793 |
| P55-asterisk-java(Link) | 4cbd23 | 39,542 | 220 | 39 | 3,299 | 17,664 |
| P56-ews-java-api(Link) | 95c6df | 46,863 | 130 | 28 | 2,419 | 31,569 |
| P57-commons-lang(Link) | e42dad | 61,518 | 2388 | 114 | 25,775 | 32,291 |
| P58-joda-time(Link) | c3ef36 | 82,998 | 4,026 | 122 | 20,957 | 28,382 |
3. Tools
- PIT: A mutation testing system, providing mutation testing and test coverage for Java and the jvm (LINK), and its all available mutators (LINK).
- WALA: A tool to collect the RTA static call graph for each test (LINK)
- JDT: A tool to collect the textual test information (LINK).
- R-lda: A R package to build topic models for test cases (LINK).
- Mallet: A tool to build topic models for test cases (LINK).
- ASM: A tool to collect the coverage information for each test case (LINK).
4. Results
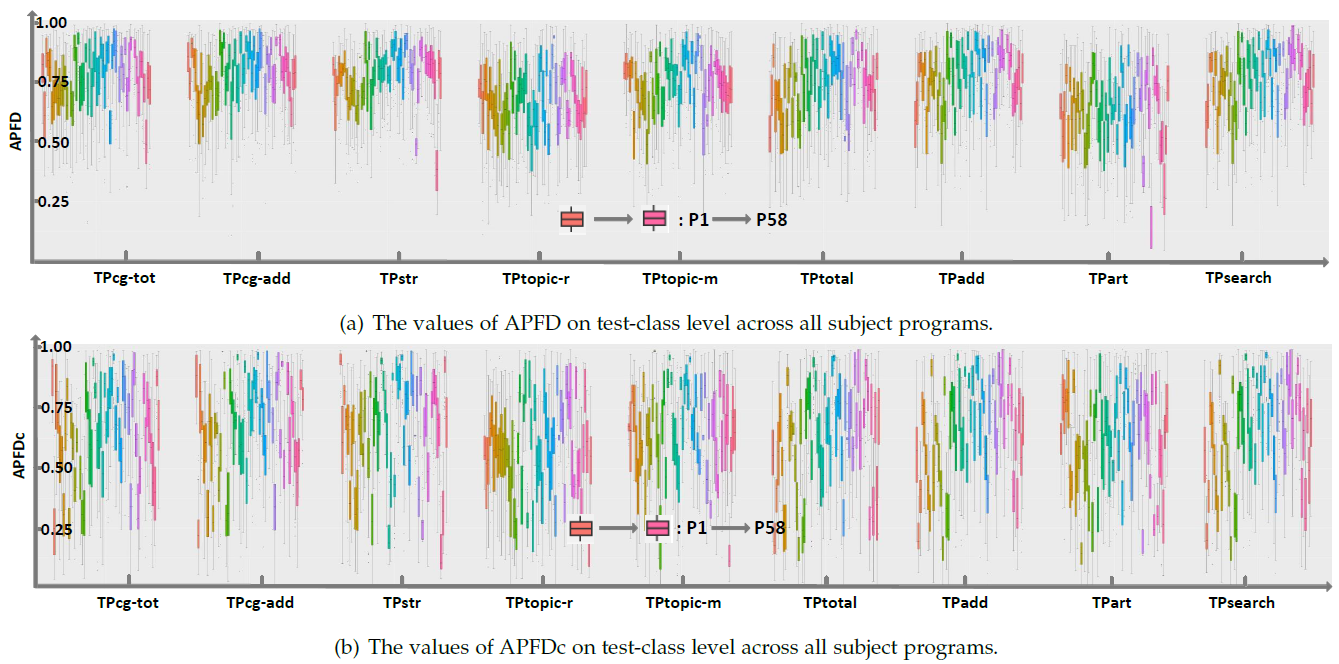
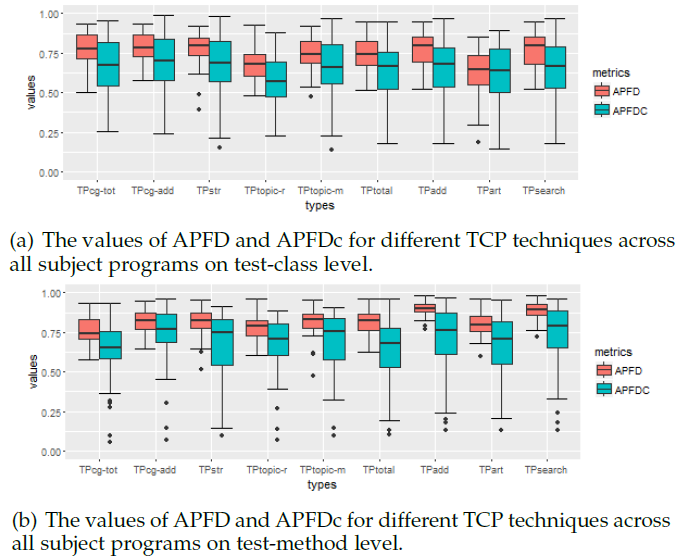
4.1 The results of APFD and APFDc for different TCP techniques across all subjects on test-class level.
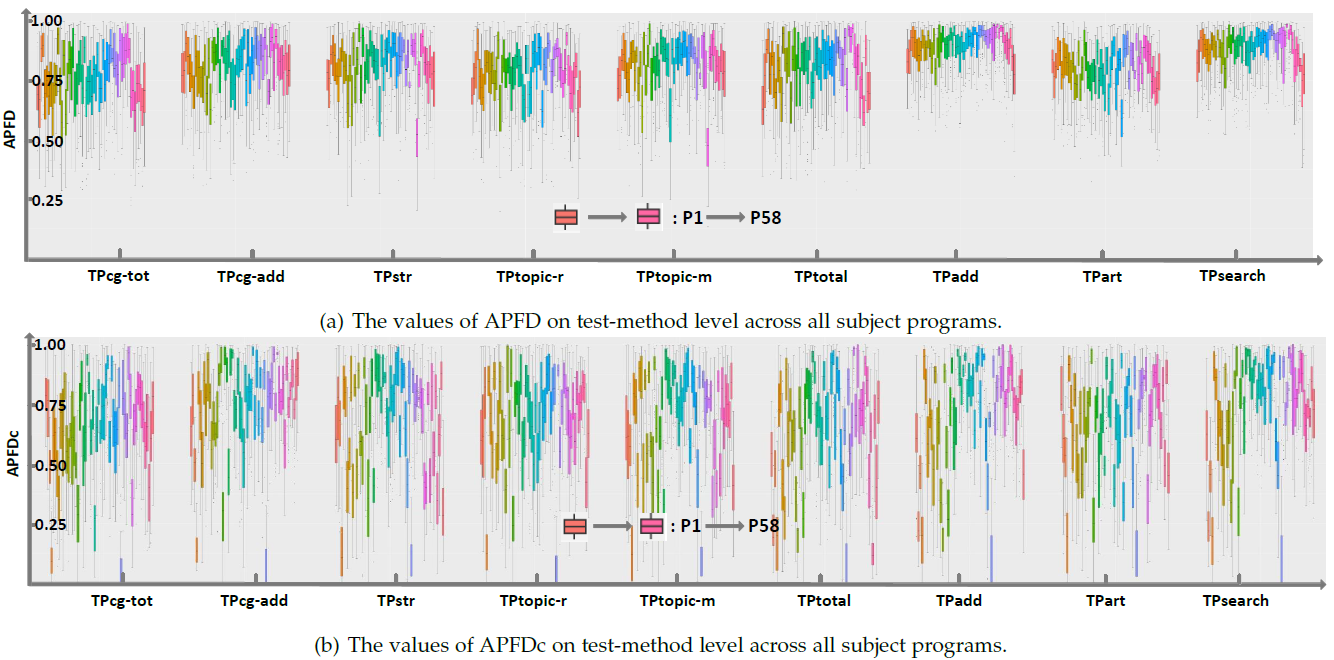
4.2 The results of APFD and APFDc for different TCP techniques across all subjects on test-method level.
4.3 The results for the ANOVA and Tukey HSD tests on the average APFD and APFDc values at test-class level.

4.4 The results for the ANOVA and Tukey HSD tests on the average APFD and APFDc values at test-method level.

4.5 The box-and-whisker plots represent the values of APFDc for different TCP techniques at different test granularities. The x-axis represents the APFDc values. The y-axis represents the different techniques. The central box of each plot represents the values from the lower to upper quartile (i.e., 25 to 75 percentile).
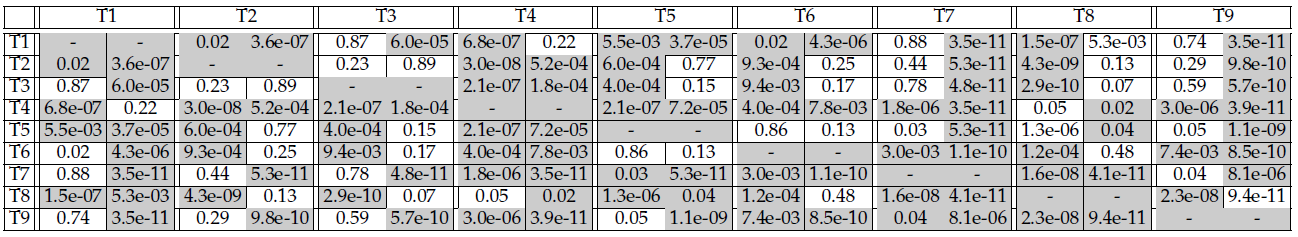
4.6 The table shows the results of Wilcoxon signed rank test on the average APFD values for each pair of TCP techniques. The techniques T1 to T9 refer to TPcg-tot, TPcg-add, TPstr, TPtopic-r, TPtopic-m, TPtotal, TPadd, TPart, TPsearch respectively. For each pair of TCP techniques, there are two sub-cells. The first one refers to the p-value at test-class level and the second one refers to the p-value at test-method level. If a p-value is less than 0.05, the corresponding cell is shaded.
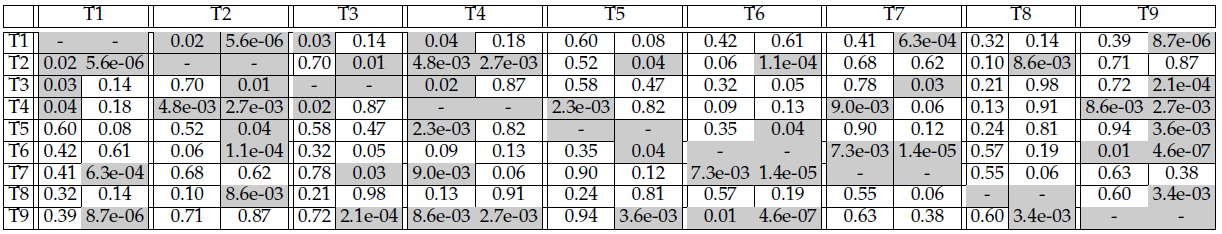
4.7 The table shows the results of Wilcoxon signed rank test on the average APFDc values for each pair of TCP techniques. The techniques T1 to T9 refer to TPcg-tot, TPcg-add, TPstr, TPtopic-r, TPtopic-m, TPtotal, TPadd, TPart, TPsearch respectively. For each pair of TCP techniques, there are two sub-cells. The first one refers to the p-value at test-class level and the second one refers to the p-value at test-method level. If a p-value is less than 0.05, the corresponding cell is shaded.
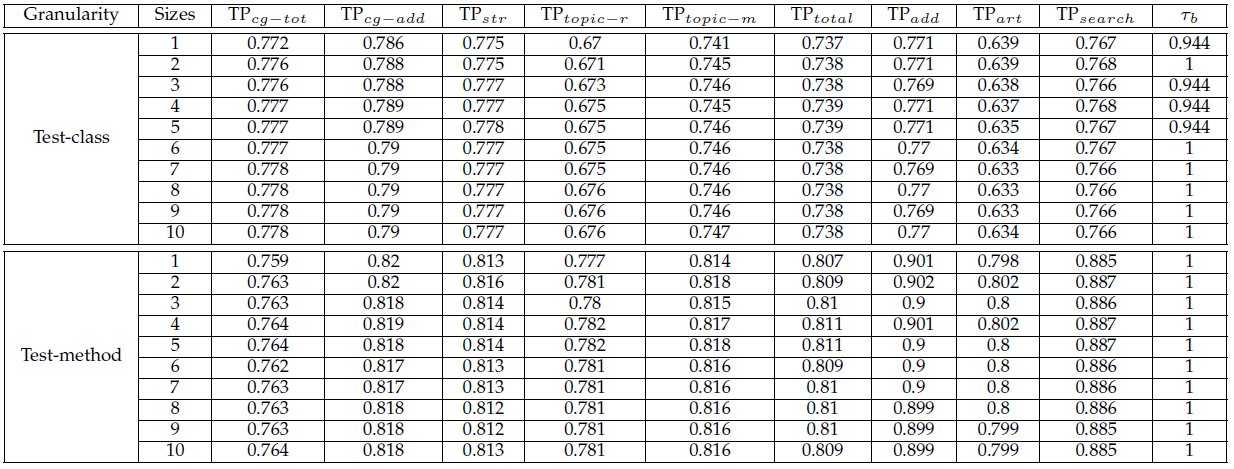
4.8 Results for average APFD values on different sizes of mutation faults. The last column shows the results for Kendall tau Rank Correlation Coefficient between the average APFD values with different sizes of mutation faults and the average APFD values with the default mutation faults.
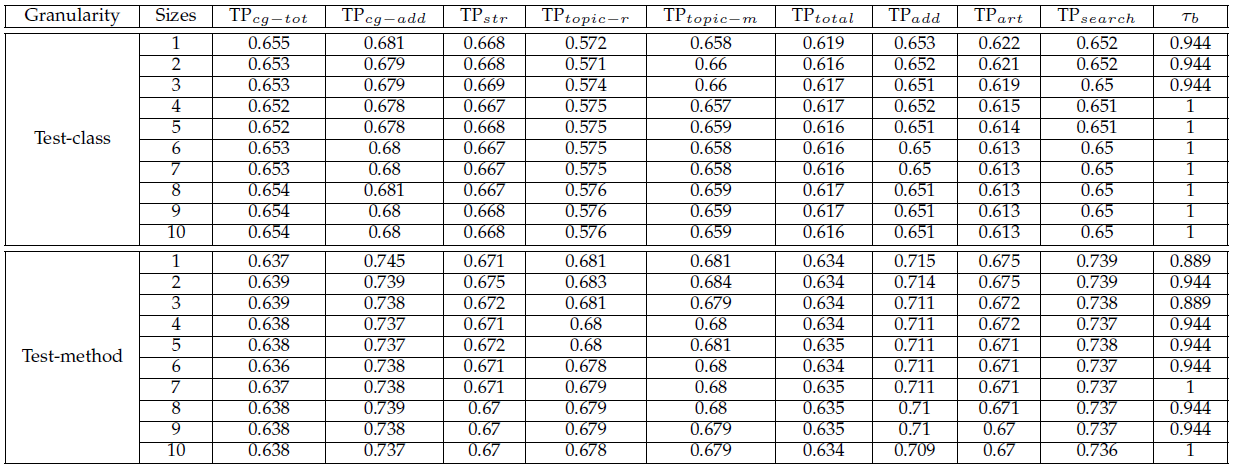
4.9 Results for average APFDc values on different sizes of mutation faults. The last column shows the results for Kendall tau Rank Correlation Coefficient between the average APFD values with different sizes of mutation faults and the average APFD values with the default mutation faults.
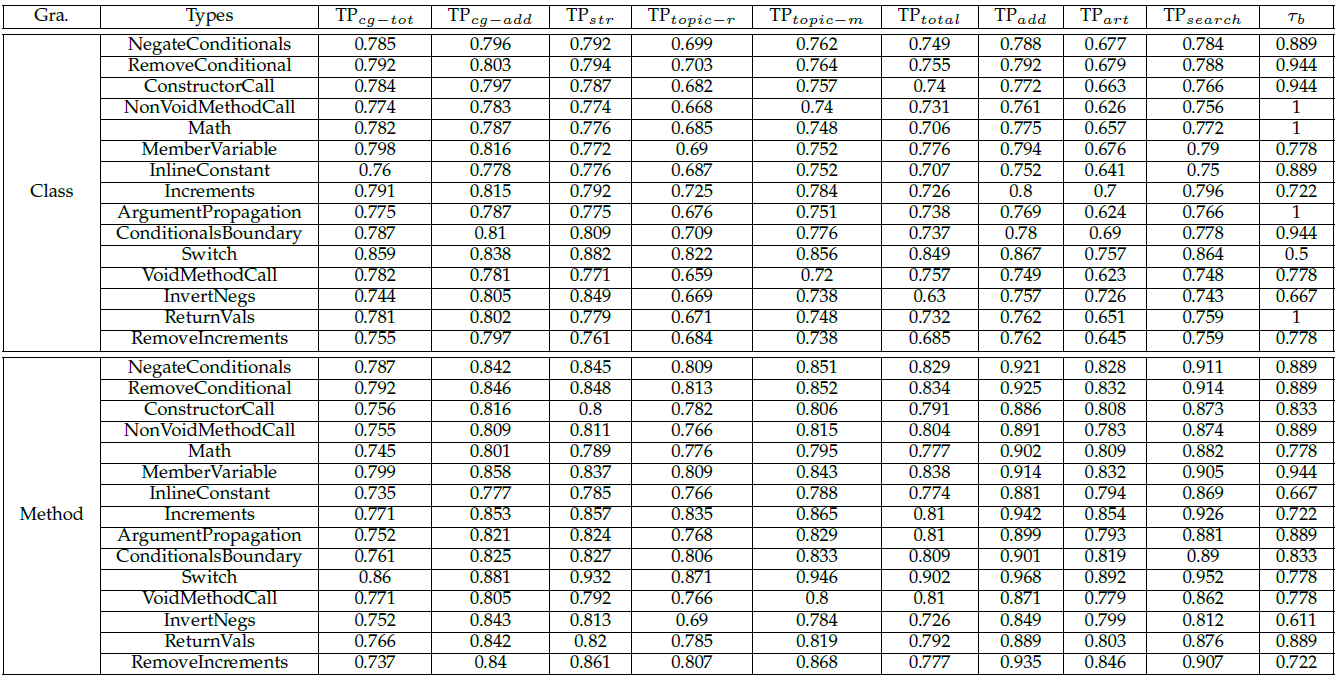
4.10 Results for average APFD values on different types of mutation faults. The last column shows the results for Kendall tau Rank Correlation Coefficient between the average APFD values with different types of mutation faults and the average APFD values with the default mutation faults.
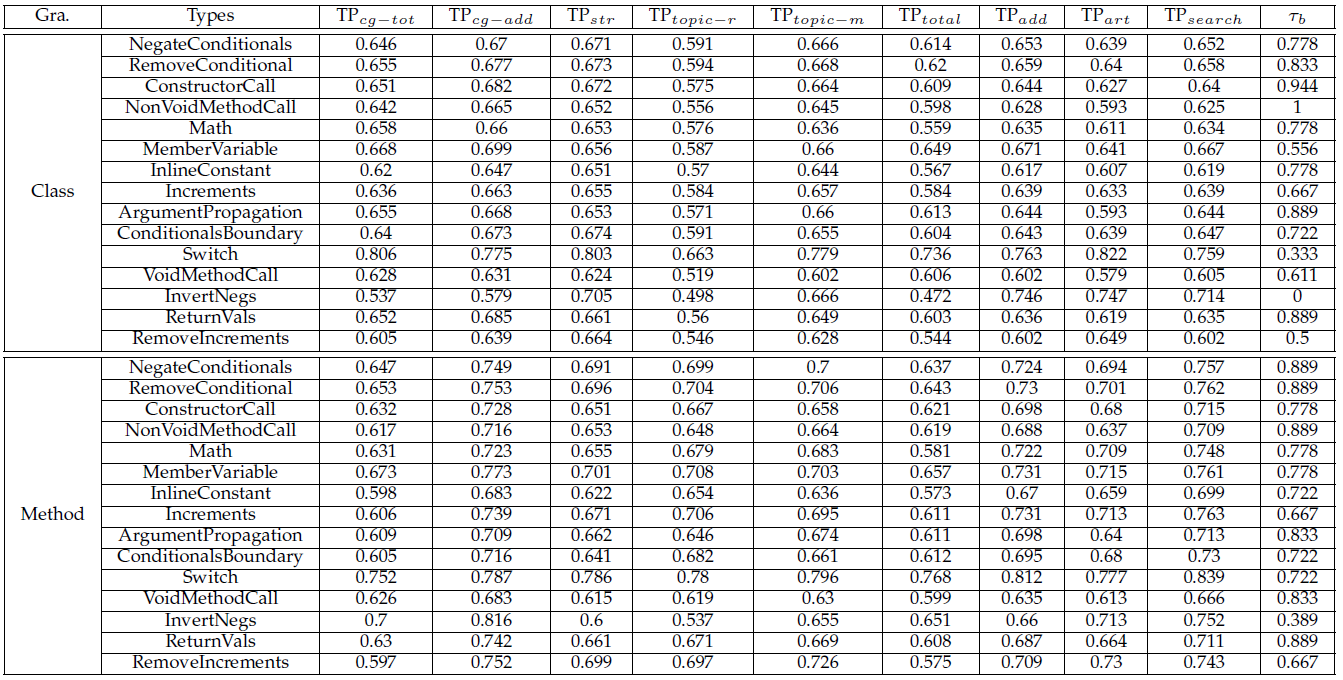
4.11 Results for average APFDc values on different types of mutation faults. The last column shows the results for Kendall tau Rank Correlation Coefficient between the average APFD values with different types of mutation faults and the average APFD values with the default mutation faults.
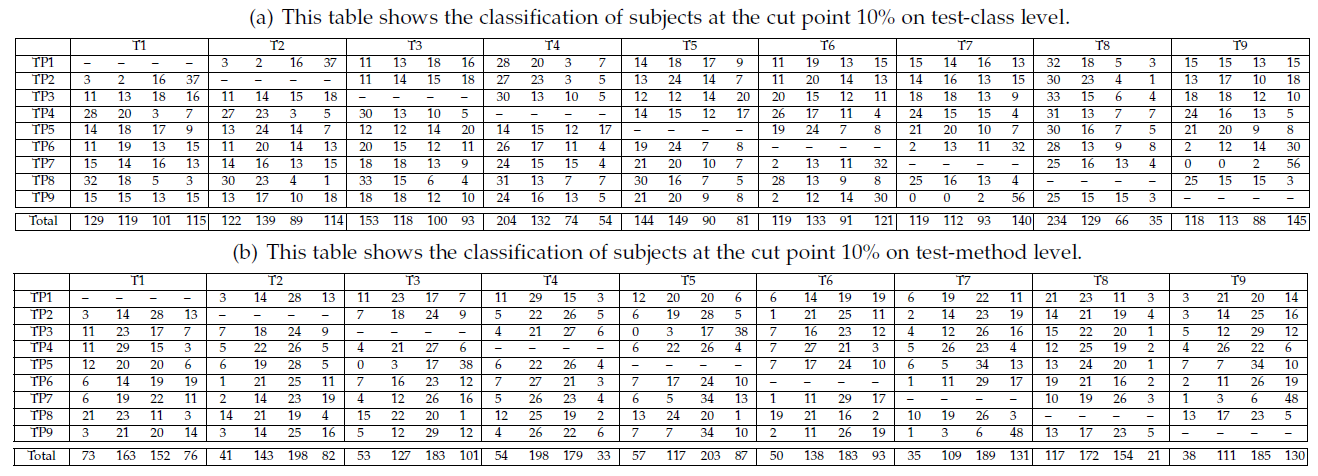
4.12 The classification of subjects on different granularities using Jaccard distance at cut point 10%. The four values in each cell are the numbers of subjects, the faults of which detected by two techniques are highly dissimilar, dissimilar, similar and highly similar respectively. The results at other cut points can be found here.
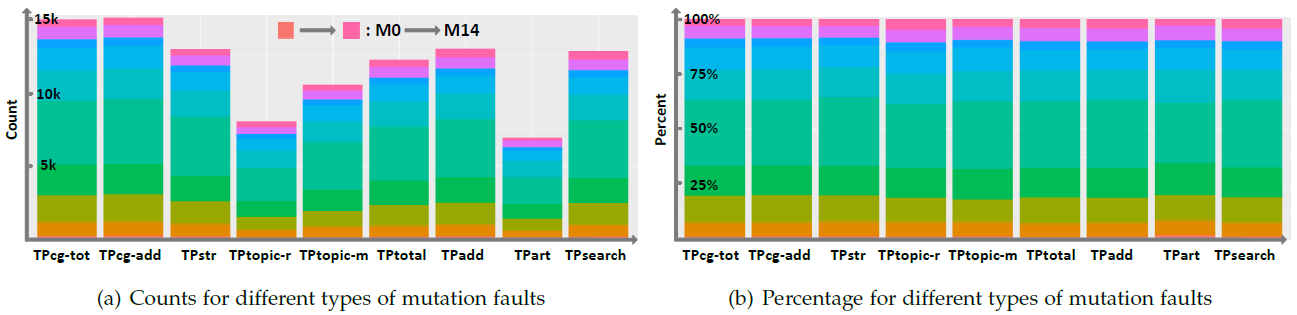
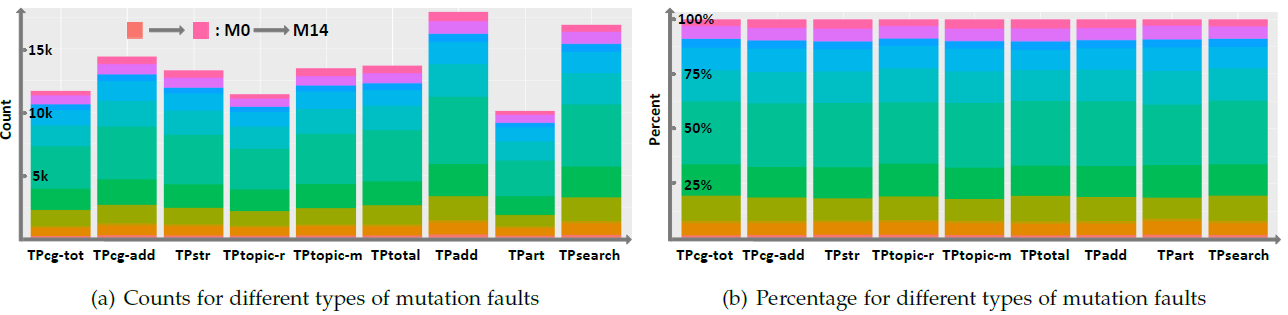
4.13 Counts and percentage for different types of mutation faults across all subjects at cut point 10% for class-level granularity.
4.14 Counts and percentage for different types of mutation faults across all subjects at cut point 10% for method-level granularity.
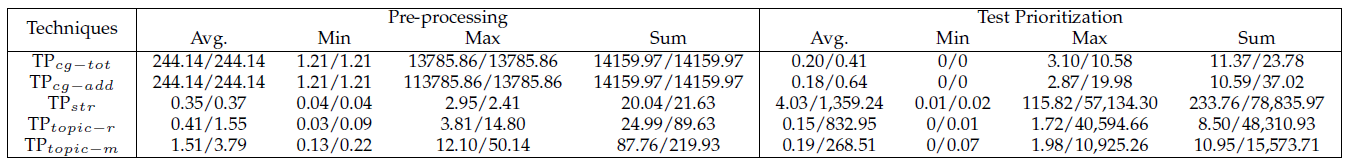
4.15 The results for execution costs for different TCP techniques.
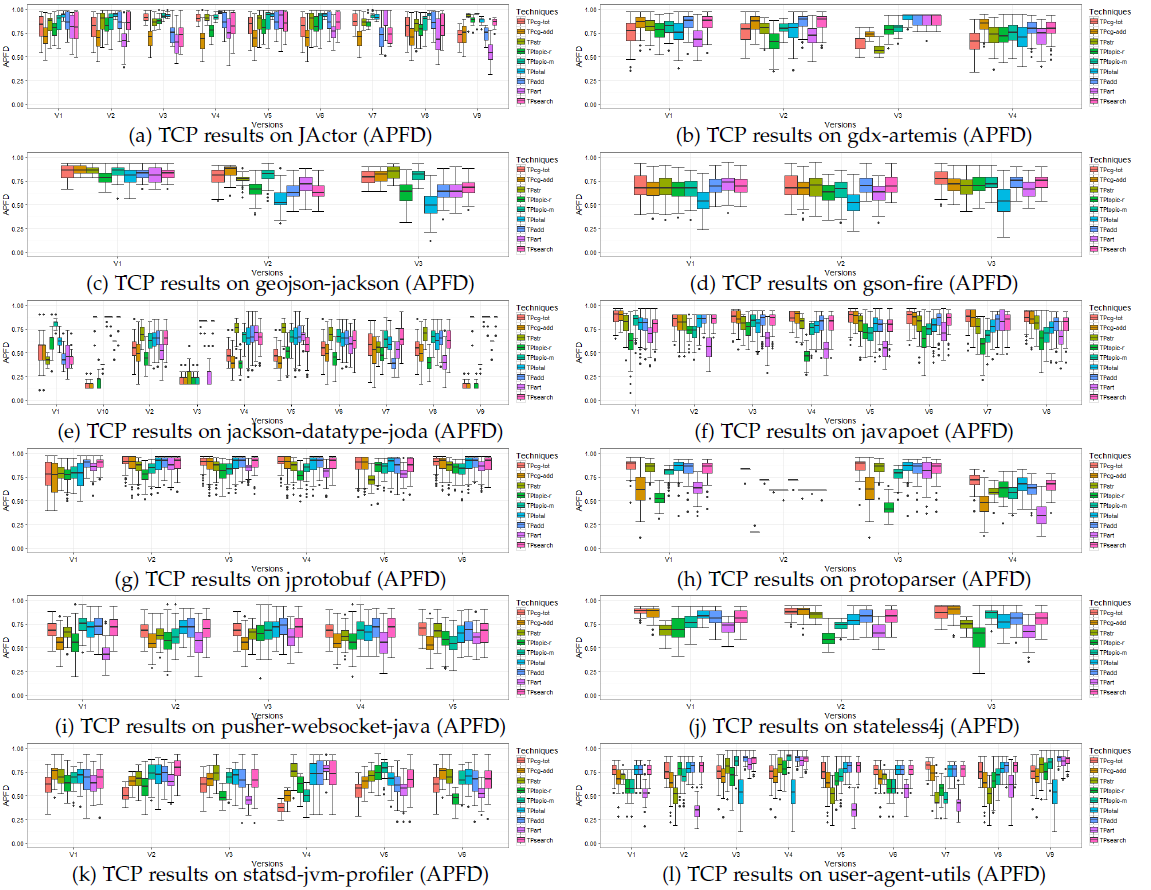
4.16 The results for TCPs in terms of APFD at test-class level in evolution scenario.
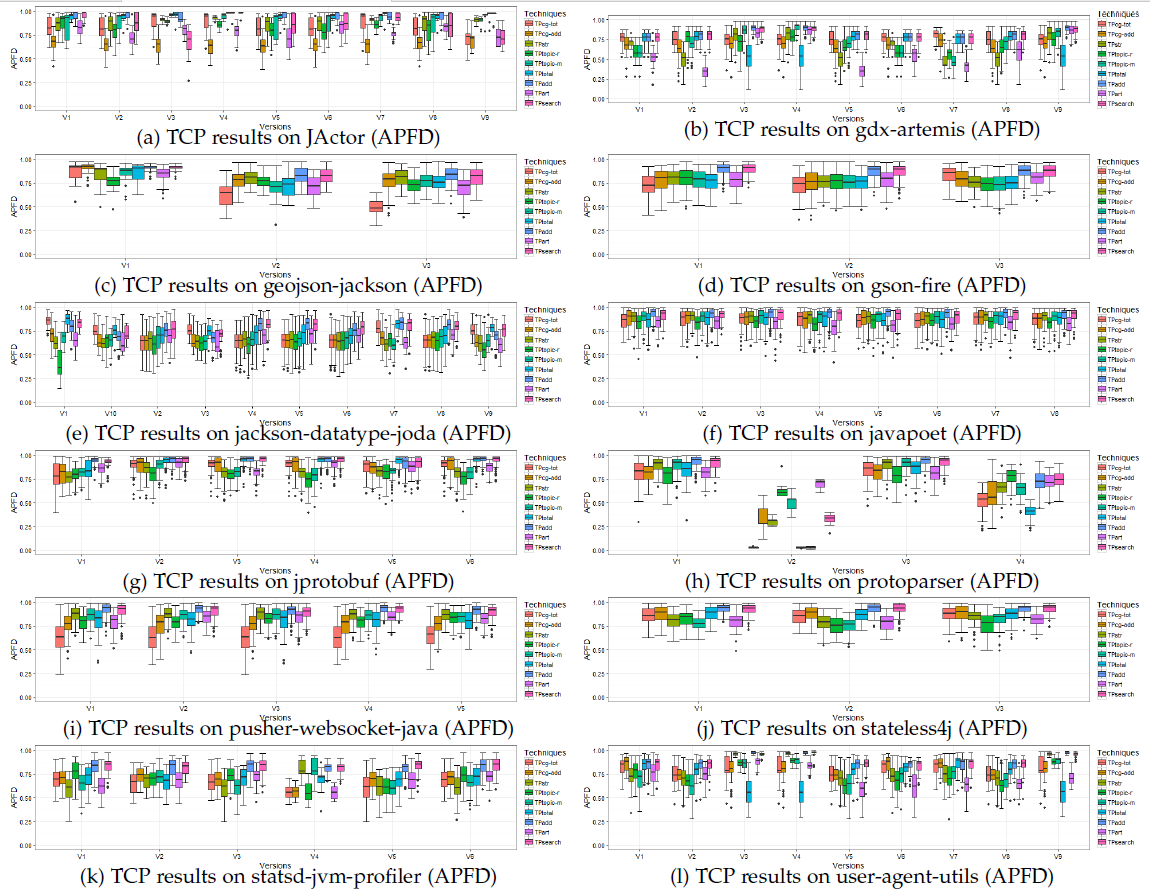
4.17 The results for TCPs in terms of APFD at test-method level in evolution scenario.
4.18 The results for TCPs in terms of APFDc at test-class level in evolution scenario.
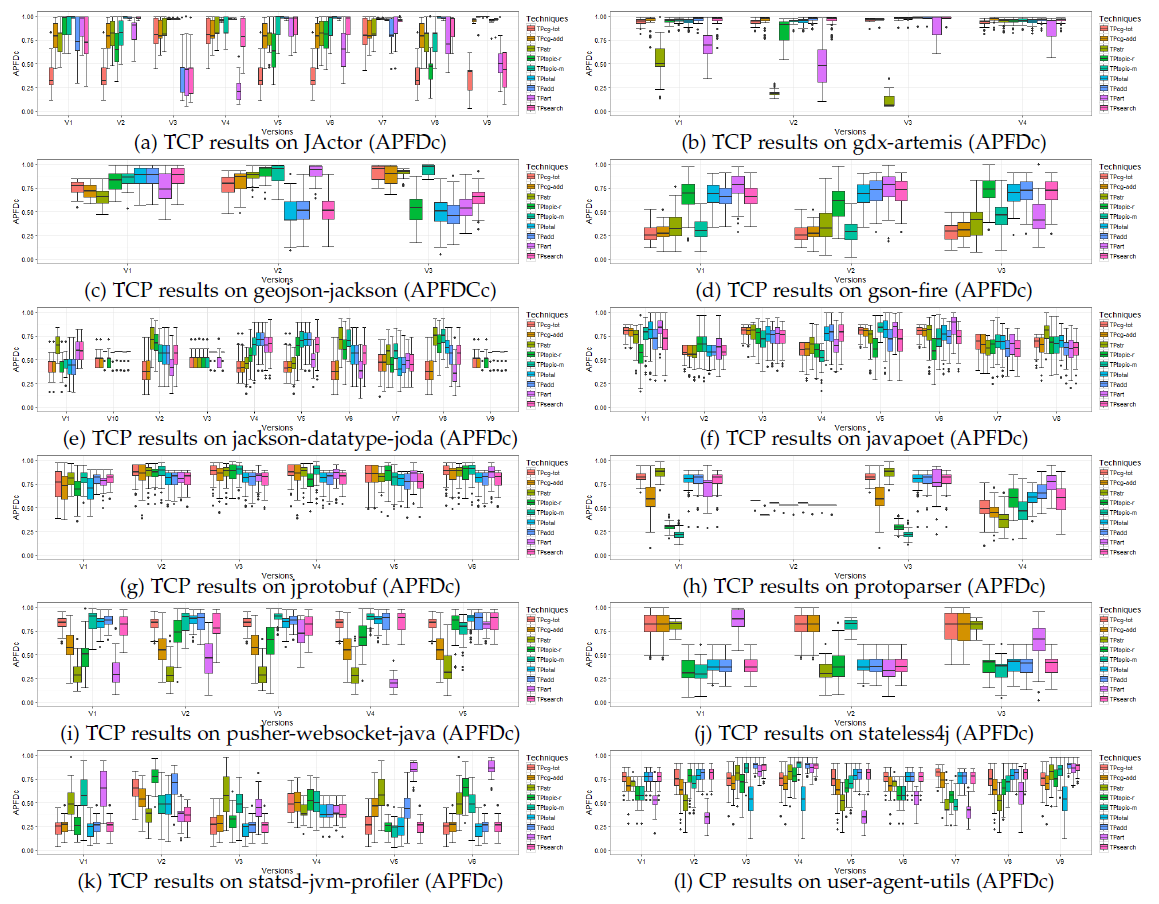
4.19 The results for TCPs in terms of APFDc at test-Method level in evolution scenario.
5. Authors
- Qi Luo
- The College of William and Mary, VA, USA.
E-mail: qluo at cs dot wm dot edu - Kevin Moran
- The College of William and Mary, VA, USA.
E-mail: kpmoran at cs dot wm dot edu - Lingming Zhang
- University of Texas at Dallas, Dallas, TX.
E-mail: ingming.zhang at utdallas dot edu - Denys Poshyvanyk
- The College of William and Mary.
E-mail: denys at cs dot wm dot edu