Traviando: Trace Analysis of Simulation Traces
Discrete event simulation is a common technique in the performance and dependability assessment of systems. Many professional and academic tools are available and applied in practice to make modeling and simulation productive. Simulation comes with few restrictions so the real crux in simulation modeling is not to obtain numbers as results but to achieve valid results. Given that most simulation framework can export simulation runs in form of a trace, this project investigates possible ways to shed light on what really happens in a single simulation run or across a set of simulation runs over a series of experiments. The goal is to make it simple and straightforward for a modeler to understand the detailed dynamic behavior of a simulation model. Traviando is the name of a corresponding software package that implements these concepts.
For students:
This project offers a multitude of interesting research questions that may serve as a topic for a Phd, Master or Master’s project. Specific topics are provided upon request.
Trace Analysis:
Input:
Traviando reads traces in from files formatted in a particular XML format.
Several simulation frameworks currently support this format:
· Mobius, a multi-formalism multi-solution framework developed by W.H. Sanders at UIUC
· APNN toolbox, a collection of tools to support modeling and analysis of generalized stochastic Petri nets, developed by Buchholz at TU Dortmund and Kemper at W&M
· ProC/B toolset, a toolset to support modeling and analysis of networks in logistics, developed by Beilner/Buchholz at TU Dortmund
· NS2, network simulator. Traviando provides a transformation module to translate NS2 traces from the NS2 nam file format into Traviando’s XML formatted input (ongoing work).
Functionality
For a given set of traces, the key question is which traces require special attention?
· Clustering: Traviando provides a variety of clustering techniques that can be applied to a set of traces and a variety of features. The resulting clusters help a modeler to select either a subset of traces that differ significantly (e.g. by selecting one representative per cluster) to check what the differences are and where they come from, or investigate the causes for a certain behavior that a subset of similar traces have (by investigating traces in a single cluster). Cardinalities of clusters help to distinguish common cases from outliers and extraordinary cases.
For a single trace, the key questions are if it is interesting and worth further consideration (i.e., what are its characteristics) and if so, where to look in a lengthy simulation run with thousands of events?
Characteristics:
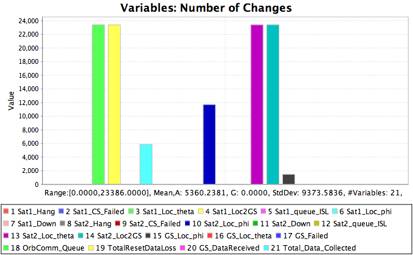
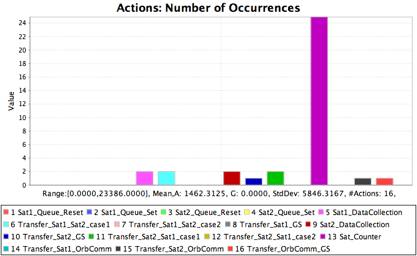
· Statistics: Traviando provides a number of statistical measures to evaluate on a trace. For example the number of times a state variable is updated or an action is performed.
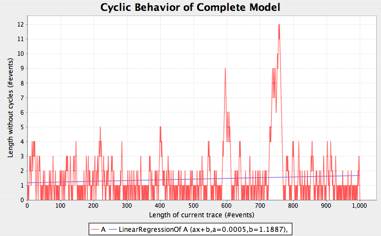
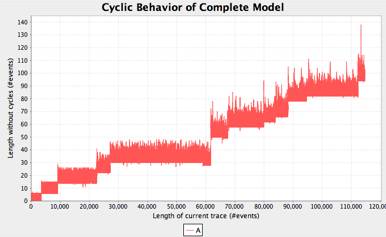
· Progress: Traviando tracks if states repeat and is able to remove such repetitions in an automated manner. The length of the shortest possible subsequence that results from the removal of such cycles is measured as progress of a simulation and plotted as a function of the length of the trace. Progress plots show distinct patterns that indicate if certain types of “problems” are present in a simulation run. For example, the left plot shows a plot for a correct server model with a normal workload, the right plot matches that of a server model with infrequent faulty events that are due to a misconfigured exception handling if the server fails.
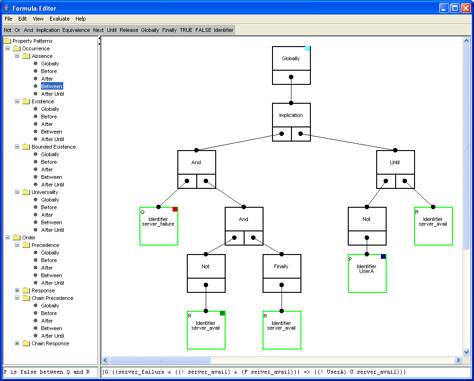
· Model checking: Traviando supports modelchecking of traces with formulas specified in LTL (linear time logic). The formula editor comes with set of predefined formulas according to a pattern system by Dwyer et al that categorizes commonly used formulas. The figures shows the editor window of the formula editor. Atomic propositions are specified in a separate window; an atomic propositions is build upon state variables and evaluates to a Boolean value for any given state in a trace.
Visualization and Browsing:
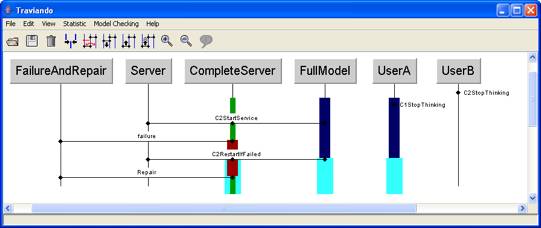
· The sequence of events in a trace is visualized in a message sequence chart like graphics, where time proceeds from top to bottom of the window and events are either shows as dots on the lifeline of the particular process they belong to if they are local events. Events that involve multiple processes, there are directed arcs if two processes are involved or undirected arcs if there are at least two processes are involved. The following figure shows an MSC-like visualization of a very short trace where parts are color highlighted depending on what formulas (with corresponding associated colors) the states fulfill that follow any event shown in the MSC. Of course, state information can be investigated as well, which takes place in a separate window with a tree-type visualization where variables are partitioned according to the process they belong to.
· Traviando also contains a trace browser, which lets a modeler investigate in what locations and contexts particular events take place in a trace. The key idea is to investigate multiple locations at once where sequences of events are equivalent.
Publications
For a list of publications please click here.
Student contributions:
· Daniel M. Gordon - Clustering Simulation Traces, undergraduate research project, summer 2007, awarded with a Chappell Undergraduate Research Fellowship, Charles Center, College of William and Mary.
· Samuel Klock - Runtime Analysis of Simulations Run in Parallel, undergraduate research project, summer 2008, awarded with a Chappell Undergraduate Research Fellowship, Charles Center, College of William and Mary.
· Nathan J. Schmidt – Debugging Support for NS2 Simulation Models, Master’s project, Spring 2008.