Benchmarks for Software Maintenance Tasks
We make publicly available a set of benchmarks (i.e., features, gold sets, execution traces) for several systems that were used frequently in case studies, and some other systems that could be used in case studies. One of our goals is to constantly update this website with data for new systems.
Feel free to use this data in your research and publications, and please use the following reference as its source:
Dit, B., Revelle, M., Gethers, M., and Poshyvanyk, D., "Feature Location in Source Code: A Taxonomy and Survey", Journal of Software Maintenance and Evolution: Research and Practice (JSME), doi: 10.1002/smr.567, to appear [pdf]
Contact Bogdan Dit for any questions related to the data.
Generating the Benchmarks
The process of generating the benchmarks is as follows:
- Choose a system and a version (e.g., jEdit v4.3)
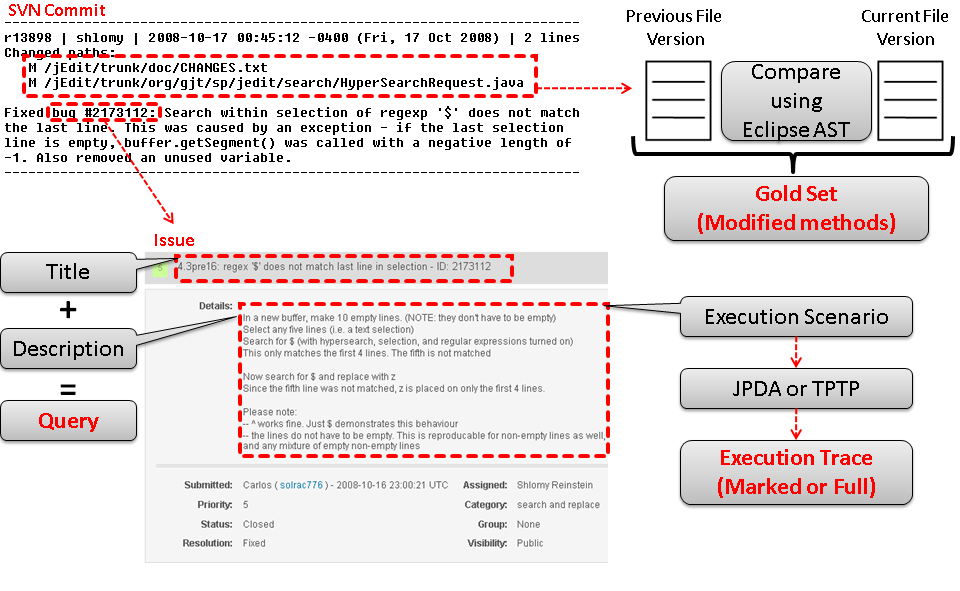
- Analyze all the SVN commits submitted between the previous version release (e.g., 4.2) and the current version (e.g., 4.3)
- The SVN logs were parsed for issue identifiers, which were mapped to issues from the issue tracking system (e.g., Bugzilla). The issues were analyzed in order to follow these requirements (i.e., the issues that did not follow these requirements were discarded)
- The issues had to pertain to the current software version (e.g., jEdit v4.3)
- The issues had to contain in their description steps to reproduce the bug or to exercise the feature, because this information would be used for collecting execution traces. For some systems we collected execution traces at method level granularity using the Java Platform Debugger Architecture (JPDA) , whereas for other systems we used the Eclipse Test & Performance Tools Platform (TPTP)
- The SVN commit changes were mapped to the methods in the source code that were modified by that commit. We build a tool based on Eclipse's Abstract Syntax Tree (from Eclipse Java Development Tools) that automatically generated a list of methods that were changed in a given SVN commit. These modified methods represent the gold set associated with a particular issue (i.e., bug or feature)
Essentially, the information extracted from SVN served as a bridge that mapped the issues from the issue tracking system with the methods from the source code that were affected in order to fix the bug, or implement the new feature. An overview of the benchmark generating process is illustrated in the following figure:

Benchmarks
The data available for the software systems is summarized in the following table. You can download the *.zip archive from the links in the table. The structure of the zip archive is as follows:
System Name and Version
- GoldSets – a folder with files named "GoldSet[ID].txt". Each file contains the gold set methods (one per line)
- Traces – a folder with files named "trace[ID].trcxml" (TPTP format) or "Trace[ID].log" (JPDA format). Each file contains the list of executed methods when collecting the trace
- Queries – a folder with files named "ShortDescription[ID].txt" (i.e., title) and "LongDescription[ID].txt" (i.e., the description). The content of these files was extracted from the issue tracking system and they are not preprocessed
- listOf[Issue]IDs.txt – a list of issue (i.e., bug/feature/patch) IDs from the issue tracking system, one per line. These IDs correspond to the [ID]s from file names from the GoldSets, Traces and Queries folders
| System [Benchmark] [Source Code] |
Version** | Period of SVN Commits Analyzed | # of issues *** [URL to Issue Tracking System] |
Gold Sets Origin | Execution traces: Type**** (Format) |
|---|---|---|---|---|---|
| ArgoUML [Benchmark] [Source Code] |
0.22 | 0.20-0.22 | 74 Defects 10 Enhancements 2 Features 5 Patches (91 Total) [URL Issues] |
SVN | Full (TPTP) |
| Eclipse* [Benchmark] [Source Code] |
3.0 | N/A* | 45 Bugs [URL Issues] |
Patches from Eclipse's Bugzilla* | Marked (JPDA) |
| JabRef [Benchmark] [Source Code] |
2.6 | 2.0-2.6 | 36 Defects 3 Features (39 Total) [URL Issues] |
SVN | Full (TPTP) |
| jEdit [Benchmark] [Source Code] |
4.3 | 4.2-4.3 | 86 Bugs 34 Features 30 Patches (150 Total) [URL Issues] |
SVN | Marked (JPDA) |
| muCommander [Benchmark] [Source Code] |
0.8.5 | 0.8.0-0.8.5 | 81 Defects 11 Enhancements (92 Total) [URL Issues] |
SVN | Full (TPTP) |
* The gold set for Eclipse 3.0 were generated by manually analyzing the patches submitted as attachments or posted as comments to the Eclipse issue tracking system
** The execution traces were collected using this version of the systems
*** The type of issues are based on the name given by the system’s issue tracking system
**** Full traces contain all the methods from the beginning of the application until the end. The marked traces were collected by controlling when to start and stop the trace (i.e., start the application, wait for the application to load, start tracing, exercise scenario, stop tracing, exit application)
Traces Format
The format of TPTP traces is in XML format and it is pretty self explanatory.
The format of a JPDA trace is as following:
thread name Number of pipes ("|") denote call stack depth methodName -- ClassNameWithFullPath$InnerClass
Example:
main:0:| 5:2  processOptions  --  org.mozilla.javascript.tools.shell.Main
main:0:| 5:2  init  --  org.mozilla.javascript.tools.shell.Global
main:0:| | 5:2  <init>  --  org.mozilla.javascript.tools.shell.Global$1
main:0:| | 5:2  call  --  org.mozilla.javascript.ContextFactory
main:0:| | 5:2  call  --  org.mozilla.javascript.ContextFactory
main:0:| | 5:2  <init>  --  org.mozilla.javascript.ScriptableObject$Slot
main:0:| | | 5:2  <clinit>  --  org.mozilla.javascript.Context
main:0:| | | | 5:2  <clinit>  --  org.mozilla.javascript.ScriptRuntime
main:0:| | | | | 5:2  classOrNull  --  org.mozilla.javascript.Kit
Remarks
- $1 denotes an anonymous class
- <init> is the class constructor, and should be replaced with the actual name of the class (e.g., from org.mozilla.javascript.tools.shell.Global.<init> to org.mozilla.javascript.tools.shell.Global.Global)
- <clinit> is for static block or class initialization (can be discarded)
- the trace does not capture the signature of the methods
We gratefully acknowledge financial support from the NSF on this research project.

